Calibrating Odds
In this blog post I am looking at predicting the outcome of football matches using the Pinnacle Sports closing odds.
reqs <- c("lubridate",
          "dplyr",
          "tidyr",
          "ggplot2",
          "caret",
          "recipes",
          "pROC")
The data is collected from football-data.co.uk. Each match is recorded with a number of full time odds. I’ve written the actual odds columns to a different csv, which I load and then subset the different odds for home and away.
gamesRaw <- loadBulkData()

oddsColumns <- data.frame(read_csv("../odds_columns.csv", col_names = FALSE))[,1]

oddsColumnsHome <- oddsColumns[endsWith(oddsColumns, "H")]
oddsColumnsAway <- oddsColumns[endsWith(oddsColumns, "A")]
oddsColumnsDraw <- oddsColumns[endsWith(oddsColumns, "D")]
To clean the data we select just the columns we are interested in, the fulltime result, the closing odds plus the season and division of the match. We then convert the FTR to a factor plus any matches where there fulltime result is missing or there are no Pinnacle sports odds available we drop.
all_na <- function(x) !all(is.na(x))

gamesRaw %>%
  dplyr::select(FTR, oddsColumns, Div, Season) %>%
  mutate(FTR = factor(FTR, levels = c("H", "A", "D"))) %>%
  drop_na(FTR, PSCH) %>%
  select_if(all_na) %>%
  select(FTR, PSCH, PSCA, PSCD, Season, Div) -> oddsFrame
We are training on all the data except for the current season and the last season, which will be used as the test set.
oddsFrame %>% filter(!Season %in% c("1718", "1819")) -> trainData
oddsFrame %>% filter(Season %in% c("1718", "1819")) -> testData
This gives us 27821 records to train on and 9520 to test the model on.
For preprocessing we use the recipes package, which allows us to write
some steps that will get applied to the training data. As a decimal odd
is the inverse of that event occurring, we start the recipe by taking
the inverse of all the closing odds. We then replace any missing values
with the mean of that column, before centring and scaling the
probabilities such that are zero mean and unit variance. Any seasons or
divisions that are present in the test set but not the training set are
given their own factor level. We then take the discrete columns (Season,
Div) and ‘one-hot’ encode them.
recObj <- recipe(FTR~., data=trainData) %>%
  step_inverse(all_numeric()) %>%
  step_meanimpute(all_numeric()) %>%
  step_center(all_numeric()) %>%
  step_scale(all_numeric()) %>%
  step_novel(Season, Div) %>%
  step_dummy(Season, Div) %>%
  prep(data=trainData)
We can now bake the data using this recipe and apply these steps to
both the training and test data.
trainDataBake <- bake(recObj, new_data = trainData)
testDataBake <- bake(recObj, new_data = testData)
Closing Odds Raw Model
The inverse of decimal odds gives the probability of an event happening. Therefore, we can take the closing odds in their raw form, invert them and take that as our prediction probabilities. The outcome with the highest event then forms our prediction of the match.
However, this is such a thing called over-round, the probabilities for all the outcomes won’t add up to 1, instead it will be slightly over, therefore, a theoretical outcome probability needs to be calculated by adjusting by this over-round. Therefore, two predictions are made; a raw prediction, straight from the odds and a theoretical prediction, adjusting for the over-round.
testData %>%
  select(FTR, PSCH, PSCA, PSCD) %>%
  mutate(HomeProbs = 1/PSCH,
         AwayProbs = 1/PSCA,
         DrawProbs = 1/PSCD,
         OverRound = HomeProbs + AwayProbs + DrawProbs,
         HomeTheo = HomeProbs / OverRound,
         AwayTheo = AwayProbs / OverRound,
         DrawTheo = DrawProbs / OverRound) -> rawProbs

rawProbs %>%
  select(HomeProbs, AwayProbs, DrawProbs) %>%
  apply(., 1, which.max) %>%
  unlist %>%
  factor(labels = c("H", "A", "D")) -> rawPreds

rawProbs %>%
  select(HomeTheo, AwayTheo, DrawTheo) %>%
  apply(., 1, which.max) %>%
  unlist %>%
  factor(labels = c("H", "A", "D")) -> theoPreds


postResample(rawPreds, testData$FTR)
##  Accuracy     Kappa
## 0.5047269 0.1785173
postResample(theoPreds, testData$FTR)
##  Accuracy     Kappa
## 0.5047269 0.1785173
The market is about 50% accurate at predicting the true outcome of the match. Unsurprisingly, accounting for the over-round didn’t change any of the predictions. So how can we test what effect the over-round has on the outcome?
Calibration
Simply put calibration means that anything you give a 10% chance of happening actually occurs 10% of the time. Therefore, you take the probabilities of the model, bin them into increasing groups and calculate the actual occurrences of that outcome.
rawProbs %>%
  select(-PSCH, -PSCA, -PSCD, -OverRound) %>%
  mutate(ID = seq_len(nrow(rawProbs))) %>%
  gather(ModelRaw, Value, -FTR, -ID) %>%
  mutate(Outcome = substr(ModelRaw, 1, 4),
         Model = substr(ModelRaw, 5, 10),
         BinaryOutcome = if_else(substr(Outcome, 1, 1) == FTR, 1, 0)) %>%
  select(ID, Value, Model, BinaryOutcome) %>%
  arrange(ID) -> calibFrame


calibFrame %>% filter(Model == "Probs") %>% select(ID, BinaryOutcome, Value) %>% rename(Raw=Value) -> rawCalibFrame
calibFrame %>% filter(Model == "Theo") %>% select(ID, BinaryOutcome, Value) %>% rename(Theo=Value) -> theoCalibFrame

cbind(rawCalibFrame, Theo=theoCalibFrame$Theo) -> allCalibFrame

allCalibFrame %>% mutate(BinaryOutcomeFac = factor(BinaryOutcome, levels=c(1,0))) -> allCalibFrame

calibRes <- calibration(BinaryOutcomeFac ~ Raw + Theo, data=allCalibFrame)
ggplot(calibRes)
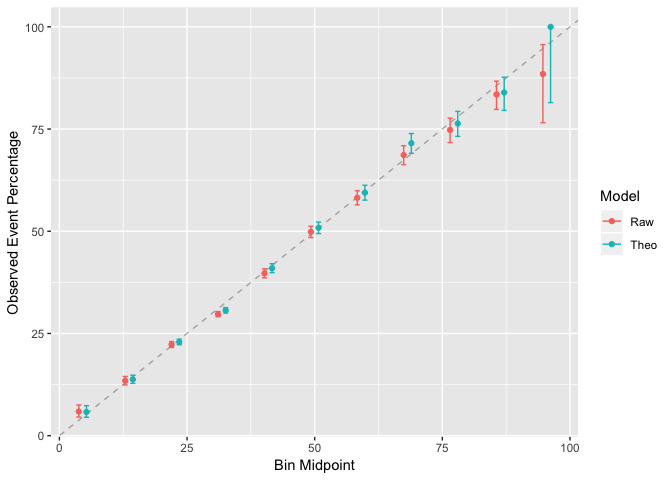
The calibration graph has the general form of a straight line, but the best model would have the points fall exactly on the dashed line, which indicates a 10% prediction happens 10% of the time. In this case we can see that for some of the points fall below the straight line, and especially at the top of the graph there is a bigger discrepancy. But we can conclude the over-round doesn’t have too much of an effect on the calibration plot.
To remedy this we can use a regression model to adjust the odds and improve the calibration and possibly the accuracy too.
Closing Odds Regression Model
In this model we are taking the Pinnacle sports closing odds and performing a multinomial regression on the full time result. This uses a bit more data, including the season and division. By including coefficients in the odds, we can potentially remove biases such as the home bias, long shot bias etc.
We use the caret package to set up the training and validation method. By using adaptive cross validation, candidate models can be selected quicker by throwing away those that are unlikely to improve on the best model. For more details see: http://topepo.github.io/caret/adaptive-resampling.html
ctrl <- trainControl(method="adaptive_cv",
                     summaryFunction = multiClassSummary,
                     classProbs=T)
pinModel <- train(FTR~.,
                  family="multinomial", method="glmnet",
                  data=trainDataBake,
                  tuneLength=50, trControl=ctrl)

pinModelPreds <- predict(pinModel, newdata = testDataBake)

postResample(pinModelPreds, testDataBake$FTR)
##  Accuracy     Kappa
## 0.5055672 0.1815975
pinModelProbs <- predict(pinModel, newdata = testDataBake, type = "prob")
The accuracy has remained the same, which means that the model is still predicting the same results as before.
By using the glmnet algorithm we can calculate the variable importance and see what is affecting the outcome of the match the most. For each outcome of the match we expect the odds of that outcome to be the main variable, anything else would suggest that our model is not behaving correctly.
varImp(pinModel)$importance %>%
  mutate(Variable=rownames(.), TotalImportance = H+A+D) %>%
  filter(TotalImportance>0) %>%
  select(-TotalImportance) -> varimps

varimps %>% gather(Outcome, Importance, -Variable) -> varimpsTidy

ggplot(varimpsTidy, aes(x=Variable, y=Importance)) + geom_bar(stat="identity") + facet_grid(~Outcome) + coord_flip()
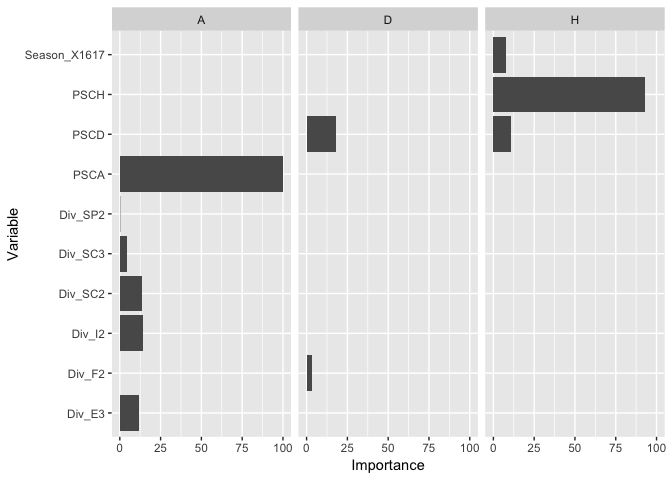
The glment algorithm provides variable importance for free, so for the best fitting model we can extract the feature importance easily. As expected, the odd of that outcome is the most important predictor for that outcome.
Now lets check the calibration.
pinModelProbs %>%
  mutate(FTR = testDataBake$FTR, ID = seq_len(nrow(pinModelProbs))) %>%
  gather(Outcome, Multi, -FTR, -ID) %>%
  mutate(BinaryOutcome = if_else(FTR==Outcome, 1, 0)) %>%
  arrange(ID) %>% select(ID, BinaryOutcome, Multi) -> pinCalib


allCalibFrame$Multi <- pinCalib$Multi

allCalibFrame %>%
  mutate(BinaryOutcomeFac = factor(BinaryOutcome, levels = c(1,0))) -> allCalibFrame

ggplot(calibration(BinaryOutcomeFac~Raw+Theo+Multi, data=allCalibFrame))
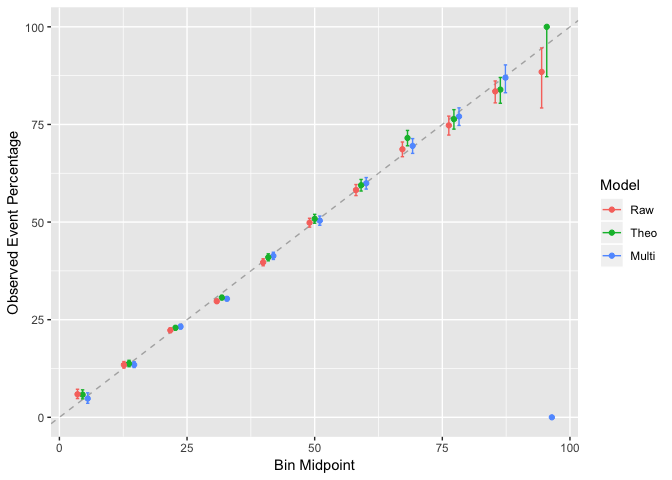
We can see a slight adjustment in the odds, buts nothing too drastic. For the added computation we haven’t changed too much.
predList <- list(Raw = rawPreds, Theo=theoPreds, Multi = pinModelPreds)

data.frame(predList, True=testDataBake$FTR) -> predFrame

lapply(predList, function(x) postResample(x, testDataBake$FTR)) %>% data.frame -> predSummary
predSummary %>%
  mutate(Metric = rownames((predSummary))) %>%
  select(Metric, everything()) -> predSummary
kable(predSummary)
| Metric | Raw | Theo | Multi |
|---|---|---|---|
| Accuracy | 0.5047269 | 0.5047269 | 0.5055672 |
| Kappa | 0.1785173 | 0.1785173 | 0.1815975 |
When calculate some metrics for the predictions, we can see that the multinomial model is able to improve the accuracy by 0.0003 and the kappa value by 0.003. The kappa value explains how much better you are than random guessing the outcome.
So overall, by using a multinomial model to recalibrate the odds, we manage to only slightly improve the predictions of the Pinnacle sports closing odds.
Alpha Generation
Now in terms of how money making ability, is it possible to extract some alpha from this model?
testData %>%
  select(FTR, PSCH, PSCA, PSCD, Div) %>%
  cbind(., 1/pinModelProbs) -> stratFrame

stratFrame %>% mutate(HomeBet = if_else(PSCH > H, 1, 0),
                      AwayBet = if_else(PSCA > A, 1, 0),
                      DrawBet = if_else(PSCD > D, 1, 0),
                      HomeRes = if_else(FTR == "H", HomeBet*(PSCH-1), -1),
                      AwayRes = if_else(FTR == "A", AwayBet*(PSCA-1), -1),
                      DrawRes = if_else(FTR == "D", DrawBet*(PSCA-1), -1),
                      Profit = HomeBet*HomeRes + AwayBet*AwayRes + DrawBet*DrawRes,
                      nBets = HomeBet+AwayBet+DrawBet) -> stratFrame
From our back-tested frame, we can analyse the results
stratFrame %>%
  summarise(TotalProfit = sum(Profit), Totalbets = sum(nBets))
##   TotalProfit Totalbets
## 1     -228.06      5007
qplot(x=seq_len(nrow(stratFrame)),
      y=cumsum(stratFrame$Profit),
      geom="line")
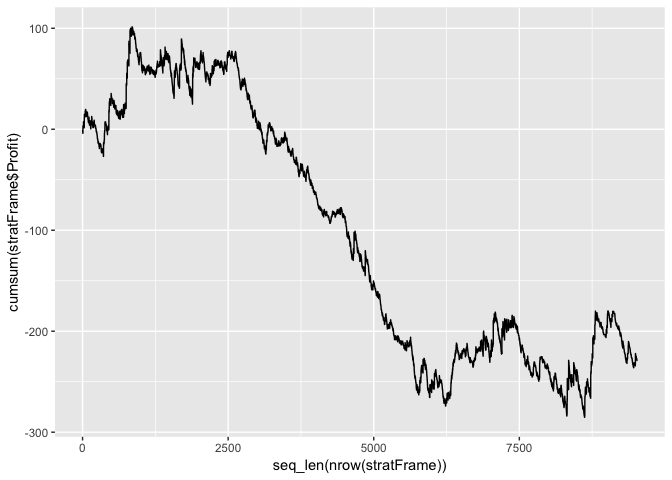
The strategy doesn’t make any money over the test period. In fact it quite catastrophically looses money!
There are some matches where we bet on two outcomes of the match and it looks like these are more profitable.
stratFrame %>%
  group_by(nBets) %>%
  summarise(TotalProfit = sum(Profit), Totalbets = sum(nBets)) %>% kable
| nBets | TotalProfit | Totalbets |
|---|---|---|
| 0 | 0.00 | 0 |
| 1 | -367.01 | 4667 |
| 2 | 138.95 | 340 |
stratFrame %>% filter(nBets == 2) -> twoBets

qplot(x=seq_len(nrow(twoBets)),
      y=cumsum(twoBets$Profit),
      geom="line")
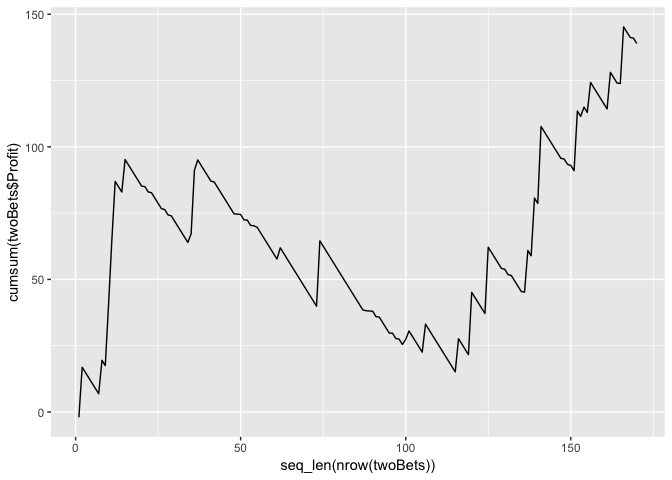
When we plot the cumulative profit we can see that its not all rosy. Plus there is a danger that this is just a data-mined artefact of the model. With such a small sample size it would be dangerous to call this alpha. More investigation would be needed.
Conclusion
The Pinnacle closing odds are very well calibrated. Adjusting by the over-round has very little effect on the calibration. Taking these odds and using them as the basis for a multinomial regression does improve the accuracy, but very little to the calibration. This improvement isn’t enough to generate any alpha blindly, but in cases when we make two bets on the outcome of the match it draws a profit in the test set.
So from this we have shown how you take the probabilities of one model and adjust them to be more representatives of the underlying outcomes. When applying it to football matches we find that its unlikely you can beat the bookies using this alone.