A Football Auto-encoder
require(readr)
require(dplyr)
require(keras)
require(knitr)
require(feather)
require(tidyr)
require(ggplot2)
require(ggrepel)
require(recipes)
source("../Betting/BettingFunctions.R")
theme_set(theme_linedraw())
In blog post I want to build an auto-encoding neural network. It will take a football teams performances over a season and code it into two values. Using these two values, we can then see if the data possess some sort of latent representation. This will be useful to see what types of season a team had. You would expect well performing teams to have a cluster of similar values and likewise, bad teams to be clustered together with similar values.
Auto-encoders
An auto-encoder is a type of neural network. It takes some input \(\mathbf{X}\) and passes it through a layers neural network to some output. We then take that output, feed it through the same network, but backwards, to see if we can reconstruct the same input.
In this work, we will be using a two-valued output. The first step is to code the data \(\mathbf{X} \rightarrow (a,b)\) before decoding the values \((a,b) \rightarrow \hat{\mathbf{X}}\). We want to minimise the loss between the input and output \(\mathbf{X} - \hat{\mathbf{X}}\).
The two output values \((a,b)\) can represent coordinates on the 2D plane which gives us a nice graphical test of the model. Plotting the \((a,b)\) values for each lets us see if any clusters emerge and deduce the distance between similar teams.
Data Preparation
Like all good machine learning tasks, 50% of the work is in preparing the data.
We start by loading all the data taken from (www.football-data.co.uk). This provides us with a number of statistics for many leagues and matches across Europe.
rawData <- loadBulkData()
We are interested in the statistics of the match, i.e. how many goals were scored, shots taken, corners conceded. These will be our features. For a full explanation of the variable names, data dictionary.
rawData %>%
  select(Div, Date, HomeTeam, AwayTeam, Season,
         FTHG, FTAG, FTR, HTHG, HTAG, HTR,
         HS, AS, HST, AST,
         HFKC, AFKC,
         HC, AC, HY, AY, HR, AR, HHW, AHW, HF, AF, HO, AO) -> rawDataFeatures
We then calculate the proportion of missing values for each match and drop the variables with more NAs than numbers. Then we can remove all rows with missing values.
rawDataFeatures %>%
  dplyr::summarise_all(list(name = ~ sum(is.na(.))/nrow(rawDataFeatures))) %>%
  sort(., decreasing = T) -> naCounts

print(naCounts[1:7])
##   HFKC_name AFKC_name  HHW_name  AHW_name   HO_name   AO_name   HF_name
## 1 0.9923998 0.9923998 0.9393533 0.9393533 0.9393442 0.9393442 0.3813312
rawDataFeatures %>%
  select(-HHW, -AHW, -HO, -AO, -HFKC, -AFKC) %>%
  drop_na %>%
  dplyr::mutate(matchID = row_number()) -> cleanData
Finally, we want to rearrange the data, so that each match is represented both as Team1 and Team2. Currently, as the data is recorded as HomeTeam and AwayTeam, filtering for a specific team only returns their home games.
cleanData %>% mutate(Home = 1) %>%
  dplyr::rename(Team1 = HomeTeam,
         Team2 = AwayTeam,
         FT1G = FTHG,
         FT2G = FTAG,
         HT1G = HTHG,
         HT2G = HTAG,
         S1 = HS,
         S2 = AS,
         ST1 = HST,
         ST2 = AST,
         C1 = HC,
         C2 = AC,
         Y1 = HY,
         Y2 = AY,
         R1 = HR,
         R2 = AR,
         F1 = HF,
         F2 = AF
         ) -> cleanData1

cleanData %>% mutate(Home = 2) %>%
  dplyr::rename(Team1 = AwayTeam,
         Team2 = HomeTeam,
         FT1G = FTAG,
         FT2G = FTHG,
         HT1G = HTAG,
         HT2G = HTHG,
         S1 = AS,
         S2 = HS,
         ST1 = AST,
         ST2 = HST,
         C1 = AC,
         C2 = HC,
         Y1 = AY,
         Y2 = HY,
         R1 = AR,
         R2 = HR,
         F1 = AF,
         F2 = HF
         ) -> cleanData2

bind_rows(cleanData1, cleanData2) %>% arrange(matchID) -> allCleanData

allCleanData %>% mutate(FTR = if_else(FT1G > FT2G, 1, if_else(FT1G == FT2G, 0, 2)),
                        HTR = if_else(HT1G > HT2G, 1, if_else(HT1G == HT2G, 0, 2))) -> allCleanData
When we check the data we can see that the correct Win/Loss/Draw record appears. This is correct for Southamptons performance last season. Which is reassuring.
allCleanData %>%
  dplyr::filter(Season == "1718", Div == "E0", Team1 == "Southampton") %>%
  group_by(FTR) %>%
  dplyr::summarise(n()) %>% kable
| FTR | n() |
|---|---|
| 0 | 15 |
| 1 | 7 |
| 2 | 16 |
Now we tally up all the matches for a team in a season. Looking at some randomly, we find that they behave as intended. Some leagues have 38 matches, some have more and others less.
allCleanData %>%
  group_by(Season, Div, Team1) %>%
  tally %>%
  ungroup -> seasonTotals

seasonTotals %>%
  sample_n(5) %>%
  kable
| Season | Div | Team1 | n |
|---|---|---|---|
| 1718 | I2 | Ascoli | 42 |
| 0203 | E2 | Wigan | 46 |
| 0910 | E1 | Cardiff | 46 |
| 1617 | SC0 | Dundee | 38 |
| 1617 | SC0 | Inverness C | 38 |
We can think of each teams matches over a season as an image, where each value is a ‘pixel’. This gives us 3379 ‘images’ that we can use for our experiment.
Feature Engineering
Using the recipes package we can build a recipe for feature engineering. We start by factorising the necessary variables and then splitting into a train and test set. We encode the fulltime and halftime result as a factor and add an indicator variable for if the team is playing at home. We also change the red card variable so that it only indicates if they had someone sent off rather than the number of red cards in the match. Finally we add a unique id for each image for ease of processing later.
One of the limitations of this model is that it requires a full season worth of data to be used. So we can’t use it for the current season in progress. Therefore, we have to use the entirety of last season as our test set.
allCleanData %>%
  mutate(FTR = factor(FTR, levels = c(0,1,2)),
         HTR = factor(HTR, levels = c(0,1,2)),
         Home = as.numeric(Home == 1),
         R1 = as.numeric(R1 > 0),
         R2 = as.numeric(R2 > 0),
         ImageID = as.character(paste0(Team1, Season))) -> allCleanData

allCleanData %>% filter(Season == "1718") -> testData
allCleanData %>% filter(Season != "1718") -> trainData
For our recipe, we remove any variables that we don’t want in the training data. We one-hot encode the factors before scaling all the numerical variables to be between 0 and 1. Standard practise for an auto-encoder.
recobj <- recipe(1 ~ ., data=trainData) %>%
  step_rm(Div, Date, Team1, Team2, Season, matchID) %>%
  step_dummy(FTR, HTR, one_hot = T) %>%
  step_range(FT1G, FT2G, HT1G, HT2G, S1, S2, ST1, ST2, C1, C2, Y1, Y2, F1, F2) %>%
  prep(data=trainData)

trainDataBake <- bake(recobj, new_data=trainData)
testDataBake <- bake(recobj, new_data=testData)

trainDataBake$ImageID <- trainData$ImageID
testDataBake$ImageID <- testData$ImageID

trainDataBake %>% select(ImageID, everything()) -> trainDataBake
testDataBake %>% select(ImageID, everything()) -> testDataBake
Like most neural network imaging tasks, we want to take the rectangular image and flatten it from 2D to 1D. This just means sticking all the rows next to each other, to make one long row. We can do the same for our football matches.
Now we write a function that can take all the matches of a team from one season and compress them into a row and insert that row into a matrix.
Now different leagues have different amounts of teams in them which means different amounts of games. Using the image analogy, this means that our dataset contains images of different sizes. To overcome this, we throw away any matches with less than 38 games. With leagues that have more than 38 matches, we just select the first 38 and throw away the rest.
flatten_dataframe <- function(trainDataBake){

  uniqueIDS <- unique(trainDataBake$ImageID)
  flattenedMatrix <- matrix(NA_real_, nrow=length(uniqueIDS), ncol=38*(ncol(trainDataBake)-1))

  for(i in seq_along(uniqueIDS)){

    idInds <- which(trainDataBake$ImageID == uniqueIDS[i])

    if(length(idInds) >= 38){
      idInds <- idInds[1:38]
    } else {
      next
    }

    rawMatrix <- as.matrix(trainDataBake[idInds, -1])

    flatVals <- c(rawMatrix)

    flattenedMatrix[i, seq_along(flatVals)] <- flatVals
  }

  trainTeams <- uniqueIDS[-which(is.na(rowSums(flattenedMatrix)))]
  flattenedMatrix <- flattenedMatrix[-which(is.na(rowSums(flattenedMatrix))), ]

  return(list(flattenedMatrix, trainTeams))

}

flatTrain <- flatten_dataframe(trainDataBake)
flatTest <- flatten_dataframe(testDataBake)
Each row of that matrix is a training example that we will use in our network.
Building the network with Keras
We will be using the Keras package to build the auto-encoder.
xtrain <- flatTrain[[1]]
Our input is 874 values. We add layers gradually stepping down the number of outputs until we reach 2 outputs. We then add back in inputs until the final layer is the same size as the input.
For each layer, we use the leaky relu activation function. As this is a nonlinear activation function, we add in a batch normalisation after each layer.
model <- keras_model_sequential()

model %>%
  layer_dense(units = 512, input_shape = ncol(xtrain)) %>%
  layer_activation_leaky_relu() %>%
  layer_batch_normalization() %>%
  layer_dense(units = 256) %>%
  layer_activation_leaky_relu() %>%
  layer_batch_normalization() %>%
  layer_dense(units = 128) %>%
  layer_activation_leaky_relu() %>%
  layer_batch_normalization() %>%
  layer_dense(units = 64) %>%
  layer_activation_leaky_relu() %>%
  layer_batch_normalization() %>%
  layer_dense(units = 32) %>%
  layer_activation_leaky_relu() %>%
  layer_batch_normalization() %>%
  layer_dense(units = 16) %>%
  layer_activation_leaky_relu() %>%
  layer_batch_normalization() %>%
  layer_dense(units = 2, name="enc") %>%
  layer_activation_leaky_relu() %>%
  layer_batch_normalization() %>%
  layer_dense(units = 16) %>%
  layer_activation_leaky_relu() %>%
  layer_batch_normalization() %>%
  layer_dense(units = 32) %>%
  layer_activation_leaky_relu() %>%
  layer_batch_normalization() %>%
  layer_dense(units = 64) %>%
  layer_activation_leaky_relu() %>%
  layer_batch_normalization() %>%
  layer_dense(units = 128) %>%
  layer_activation_leaky_relu() %>%
  layer_batch_normalization() %>%
  layer_dense(units = 256) %>%
  layer_activation_leaky_relu() %>%
  layer_batch_normalization() %>%
  layer_dense(units = 512) %>%
  layer_activation_leaky_relu() %>%
  layer_batch_normalization() %>%
  layer_dense(units=ncol(xtrain), activation = "sigmoid")

model %>% compile(
  loss = "mean_squared_error",
  optimizer = "adam"
)
Finally, as our data is scaled to be between 0 and 1, the final layer has a sigmoid activation function to make sure the outputs fall in the correct range. We are using the mean squared error between the original and reconstructed output.
model %>% fit(
  x = xtrain,
  y = xtrain,
  epochs = 50,
  batch_size = 1024,
  validation_split = 0.2
) -> fittedModel
plot(fittedModel)
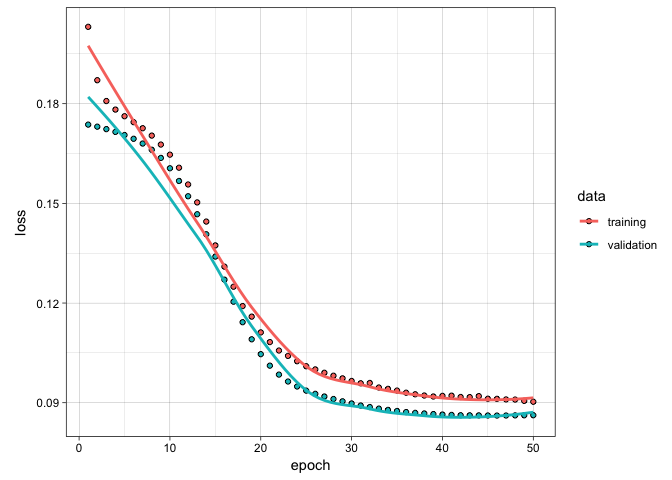
50 epochs is about the sweet spot for training. This only takes about 2 minutes to train on my laptop. Nothing too strenuous at all.
We want the encoding layer, so create a new model that gets the neural net up until the middle layer.
layer_name <- 'enc'
intermediate_layer_model <- keras_model(inputs = model$input,
                                        outputs = get_layer(model, layer_name)$output)
Now with the model trained and the encoding obtained, what does the output look like?
For this we calculate the \((a,b)\) values for each teams season in the test set.
xtest <- flatTest[[1]]

intermediate_output <- predict(intermediate_layer_model, xtest)

testData %>%
  filter(ImageID %in% flatTest[[2]]) %>%
  select(ImageID, Div, Team1, Season) -> resOrigData

data.frame(intermediate_output, ImageID = flatTest[[2]]) -> resFrame

resFrame$Div <- resOrigData$Div[match(resFrame$ImageID, resOrigData$ImageID)]
resFrame$Team <- resOrigData$Team1[match(resFrame$ImageID, resOrigData$ImageID)]
resFrame$Season <- resOrigData$Season[match(resFrame$ImageID, resOrigData$ImageID)]
We then subset the data down into last years Premier League. Man City won the title without too much trouble. Swansea, West Brom and Stoke got relegated.
resFrame %>% filter(Div %in% c("E0")) -> resFramePremier

ggplot(resFramePremier, aes(x=X1, y=X2, label=Team)) +
  geom_label_repel()
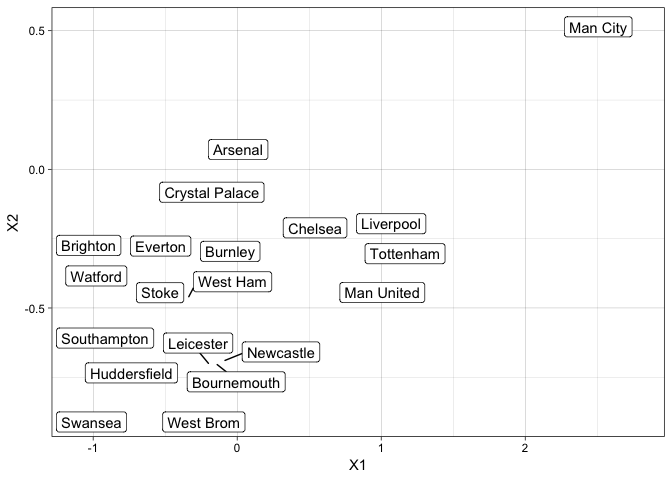
Looking at last seasons Premier League, we can see that the data is forming sensible clusters. Man City are on their own, way away from everyone else. The other top teams form a cluster slightly further away from the bulk of the teams. The worst performing, Swansea and West Brom, teams fall at the bottom of the graph.
Analysis
From looking at the test set we can deduce that the auto encoder has found some sort of representation. What can we do with this information?
Well, we can start choosing a teams performance over the season and seeing what other teams in the data are close to it.
xtest <- flatTest[[1]]

intermediate_output <- predict(intermediate_layer_model, rbind(xtrain, xtest))

allCleanData %>%
  select(ImageID, Div, Team1, Season) -> resOrigData

data.frame(intermediate_output, ImageID = c(flatTrain[[2]], flatTest[[2]])) -> resFrame

resFrame$Div <- resOrigData$Div[match(resFrame$ImageID, resOrigData$ImageID)]
resFrame$Team <- resOrigData$Team1[match(resFrame$ImageID, resOrigData$ImageID)]
resFrame$Season <- resOrigData$Season[match(resFrame$ImageID, resOrigData$ImageID)]
For example, the Invincible team of Arsenal in 2003/4. In this season, the Arsenal team went unbeaten. A feat that has yet to be achieved again in the Premier League. Using this auto-encoder, we can see what other teams in what season have similar features.
invID <- which(resFrame$ImageID == "Arsenal0304")

resFrame[order(rowSums((c(resFrame[invID, 1:2]) - resFrame[, 1:2])^2)),] %>% head(10) -> goodData

ggplot(goodData, aes(x=X1, y=X2, label=ImageID)) +
  geom_label_repel() +
  ggtitle("Good Teams")
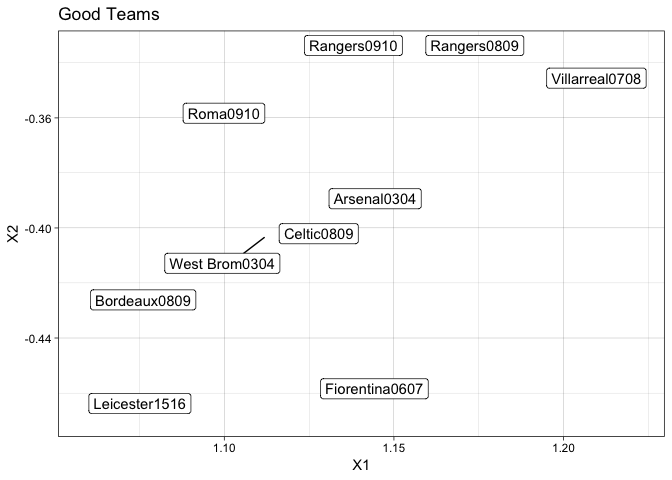
Unsurprisingly, they are all teams you expect to be close. Bordeaux won the league in 0809. The legendary Leicester season. The West Brom 0304 team actually only came second in the First Division (now the Championship). So there are some quirks in the clustering, but it give us some insight into comparing these types of feats.
The worst team in modern history is the Derby 07/08. They achieved the lowest points total ever and only achieved one win in the entire season. What other teams can claim similar seasons?
crapID <- which(resFrame$ImageID == "Derby0708")

resFrame[order(rowSums((c(resFrame[crapID, 1:2]) - resFrame[, 1:2])^2)),] %>% head(10) -> badData

ggplot(badData, aes(x=X1, y=X2, label=ImageID)) +
  geom_label_repel() +
  ggtitle("Not So Good Teams")
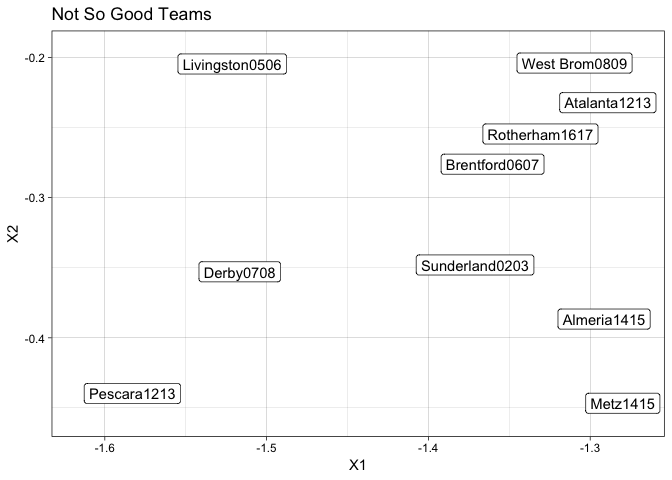
The majority of these teams found themselves relegated at the end of the season. The likes of Sunderland, Brentford and West Brom came dead last in their respective leagues. This is not group you want to be part of.
Conclusion
This auto-encoder appears to have found some underlying representation of the data. When we subset the data into ‘good’ teams, we find that it pulls teams we would expect and likewise for bad teams. This shows that there is some sort of value in the auto-encoder representation.
However, it is limited. The fact that it can only be used once the entire season has been played makes it useless for inter-season prediction. It perfroms a explanation task rather than a prediction task. There are techniques that can overcome this, but I will save that for another day.
Secondly, like my most neural network models, its a bit of a black box. We do not know what features cause what changes to the \((a,b)\) values. So each teams actual \((a,b)\) values are arbitrary, we can only use the relative values to compare teams.