Conjugate Stan Models and Hierarchy
require(rstan)
require(dplyr)
require(tidyr)
require(ggplot2)
numIts <- 1000
One of the benefits of using a conjugate prior in a Bayesian context is
the simple posterior sampling. In R this can be as easy as using the
rgamma function to draw samples given the posterior parameters.
However, once you start adding in hierarchical levels you need to start
doing nonconjugate sampling, such as Metropolis-Hastings, which can
complicate your code.
In this blog post I will be showing how we can take a conjugate model,
add in some hierarchy and sample everything nicely in Stan.
The Model
To make sure that the correct parameters are recovered we will be generating data from a toy model. There will a number of groups that have Poisson observations with a parameter that is drawn from some common distribution.
\[\begin{aligned} N_i & \sim \text{Poisson} (\lambda _i) \\ \lambda _i & \sim \text{Gamma} (8, 2) \end{aligned}\]Our hierarchical distribution is the \(\text{Gamma} (8, 2)\) function and our sampling method needs to be able to recover this.
nGroups <- 9
lambdas <- rgamma(nGroups, 8, 2)
nobs <- ceiling(rexp(nGroups, 1/50))

testData <- lapply(seq_len(nGroups), function(i) cbind(rpois(nobs[i], lambdas[i]),i))

testFrame <- do.call(rbind, testData)

trueLambda <- data.frame(Lambda = paste0("lambda.", seq_len(nGroups)),
                         Value=lambdas,
                         Nobs = nobs)
This gives us 536 observations of 9 different groups.
The likelihood is the Poisson distribution, therefore a conjugate prior is the gamma distribution.
\[\begin{aligned} N_i & \sim \text{Poisson} (\lambda _i) \\ \lambda & \sim \text{Gamma} (\alpha _0, \beta _0) \\ \lambda \mid N _i & \sim \text{Gamma} (\alpha _0 + \sum _{i=1} ^n N_i, \beta _0 + n) \end{aligned}\]Simple Model
From the above equation we can see that the posterior parameters are the
sum of the observations in the group and the total number of
observations in the group. We could sample from this distribution using
rgamma or we could use Stan with a view to extend it in future.
sumParam <- vapply(testData, function(x) sum(x[,1]), numeric(1))
lenParam <- vapply(testData, nrow, numeric(1))
This is easily written in Stan whilst making full use of vectorisation. The prior parmeters \((\alpha _0, \beta _0)\) are set to values of 0.01
data {
  int<lower=0> N;
  vector[N] sumParam;
  vector[N] lenParam;
}

parameters {
  real<lower=0> lambda[N];
}


model {
  lambda ~ gamma(sumParam + 0.01, lenParam + 0.01);
}
noPoolModel <- stan_model("nopool.stan")

noPoolData <- list()
noPoolData$sumParam <- sumParam
noPoolData$lenParam <- lenParam
noPoolData$N <- length(noPoolData$sumParam)

noPoolSamples <- sampling(noPoolModel, noPoolData, iter=numIts, chains=2, refresh=-1)
## Chain 1:
## Chain 1: Gradient evaluation took 2.2e-05 seconds
## Chain 1: 1000 transitions using 10 leapfrog steps per transition would take 0.22 seconds.
## Chain 1: Adjust your expectations accordingly!
## Chain 1:
## Chain 1:
## Chain 1:
## Chain 1:  Elapsed Time: 0.023512 seconds (Warm-up)
## Chain 1:                0.023584 seconds (Sampling)
## Chain 1:                0.047096 seconds (Total)
## Chain 1:
## Chain 2:
## Chain 2: Gradient evaluation took 7e-06 seconds
## Chain 2: 1000 transitions using 10 leapfrog steps per transition would take 0.07 seconds.
## Chain 2: Adjust your expectations accordingly!
## Chain 2:
## Chain 2:
## Chain 2:
## Chain 2:  Elapsed Time: 0.030184 seconds (Warm-up)
## Chain 2:                0.02138 seconds (Sampling)
## Chain 2:                0.051564 seconds (Total)
## Chain 2:
Sampling done and no issues with divergence or stepsize.
plot_lambdas <- function(smpls){

  lambdaSamples <- as.data.frame(rstan::extract(smpls, pars="lambda"))

  lambdaSamples %>% gather(Lambda, Value) -> lambdaSamplesTidy


  ggplot(lambdaSamplesTidy, aes(x=Value, y=..ncount..)) +
    geom_histogram() +
    facet_wrap(~Lambda) +
    geom_vline(data=trueLambda, aes(xintercept=Value), colour="red") +
    geom_text(data=trueLambda, aes(x=7.2, y=0.8, label = paste0("Obs:", Nobs)))

}

plot_lambdas(noPoolSamples)
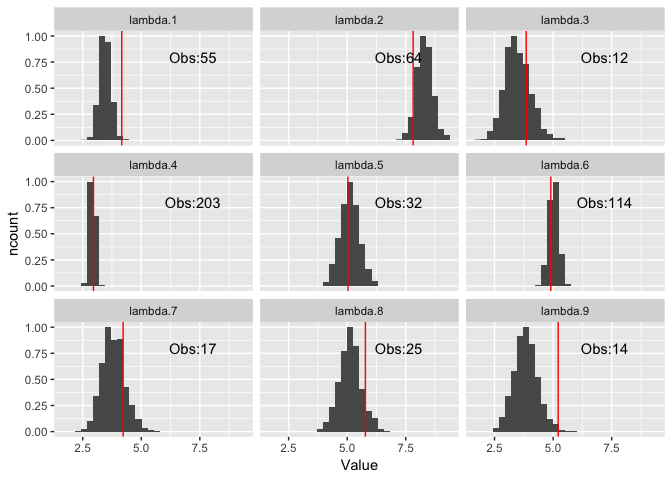
All of the true values fall inside the posterior distributions, with some wider than the others due to the amount of data available. This is what we expect for a ‘no pool’ model. None of the data is shared and therefore no benefits from the hierarchy.
In the sampler, we set the parameters to \((\alpha_0 = \beta _0 =0.01)\) which is the typical ‘uninformative’ prior 1. Now we want to find the best fitting prior distribution and actually sample values of \(\alpha _0\) and \(\beta _0\). This pools the data and we get the benefit of sharing.
A Hierarchical Model
In Stan, we alter the program to allow the hyperparameters to vary. We fit the same data with the same setting and assess the outcome.
This involves changing the model section of the Stan program. Now the \(\lambda\) parameter is from both the prior and the posterior.
model {
  alpha0 ~ normal(0, 5);
  beta0 ~ normal(0, 5);
  lambda ~ gamma(alpha0, beta0);
  lambda ~ gamma(sumParam + alpha0, lenParam + beta0);
}
We load and fit this model with the same data. It takes slightly longer than the simple model but still takes no time at all.
poolModel <- stan_model("pool.stan")
poolSamples <- sampling(poolModel, noPoolData, iter=numIts, chains=2, refresh=-1)
## Chain 1:
## Chain 1: Gradient evaluation took 2.7e-05 seconds
## Chain 1: 1000 transitions using 10 leapfrog steps per transition would take 0.27 seconds.
## Chain 1: Adjust your expectations accordingly!
## Chain 1:
## Chain 1:
## Chain 1:
## Chain 1:  Elapsed Time: 0.116317 seconds (Warm-up)
## Chain 1:                0.143768 seconds (Sampling)
## Chain 1:                0.260085 seconds (Total)
## Chain 1:
## Chain 2:
## Chain 2: Gradient evaluation took 1.7e-05 seconds
## Chain 2: 1000 transitions using 10 leapfrog steps per transition would take 0.17 seconds.
## Chain 2: Adjust your expectations accordingly!
## Chain 2:
## Chain 2:
## Chain 2:
## Chain 2:  Elapsed Time: 0.100961 seconds (Warm-up)
## Chain 2:                0.089684 seconds (Sampling)
## Chain 2:                0.190645 seconds (Total)
## Chain 2:
graph_hyper_parmas <- function(smpls, xGrid){

  hyperParams <- as.data.frame(rstan::extract(smpls, pars=c("alpha0", "beta0")))
  hyperParams %>% gather(Parameter, Value) -> hyperParamsTidy

  priorEvals <- data.frame(apply(hyperParams, 1, function(x) dgamma(xGrid, x[1], x[2])))
  priorEvals$x <- xGrid

  priorEvals %>% gather(Iteration, Value, -x) -> priorEvalTidy

  priorEvalTidy %>% group_by(x) %>% summarise(Mean=mean(Value),
                                              LQ = quantile(Value, prob=0.025),
                                              UQ = quantile(Value, prob=1-0.025)) -> priorSummary

  ggplot(priorSummary) +
    geom_ribbon(aes(x=x, ymin=LQ, ymax=UQ), alpha=0.4) +
    geom_line(aes(x=x, y=Mean)) +
    stat_function(fun=function(x) dgamma(x, 8, 2), colour="red")

}
plot_lambdas(poolSamples)
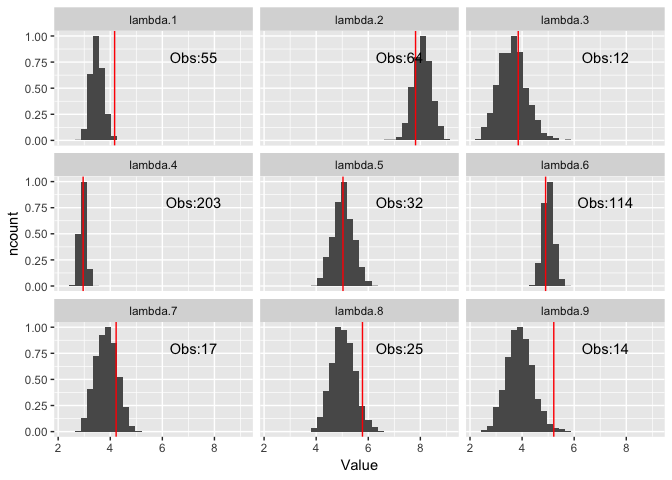
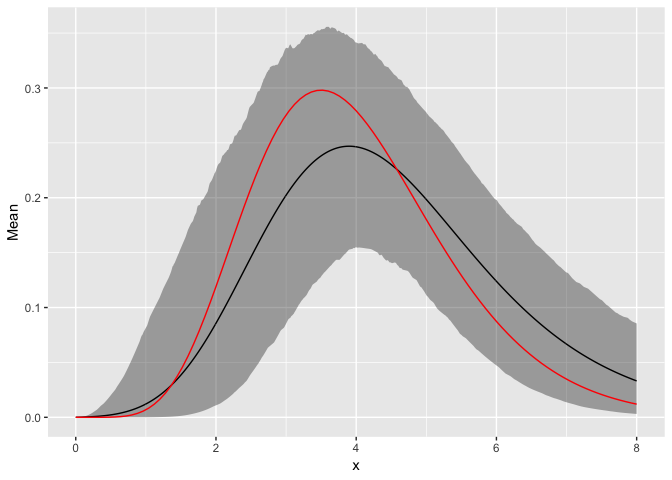
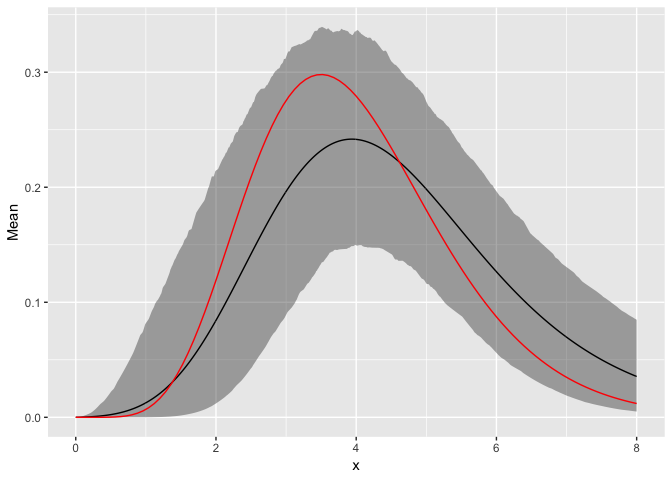
Again, the \(\lambda\) samples align with the true parameters which is reassuring. When we graph the resulting \(\alpha _0, \beta _0\) values we find that they are getting the correct values. So whilst we are exploiting the conjugacy we can still add in hyper parameters.
graph_hyper_parmas(poolSamples, seq(0, 8, by=0.01))
A Nonconjugate Model
Just for comparison, we write the full model out in Stan not using any of the conjugacy benefit.
data {
  int<lower=0> N;
  int<lower=0> NGroups;
  int y[N];
  int group[N];
}

parameters {
  real<lower=0> lambda[NGroups];

  real<lower=0> alpha0;
  real<lower=0> beta0;
}

model {
  alpha0 ~ normal(0, 5);
  beta0 ~ normal(0, 5);

  lambda ~ gamma(alpha0, beta0);

  for(i in 1:N)
    y[i] ~ poisson(lambda[group[i]]);
}
noconjugateModel <- stan_model("nonconjugate.stan")

nonconjData <- list()

nonconjData$y <- testFrame[,1]
nonconjData$group <- testFrame[,2]
nonconjData$N <- length(nonconjData$y)
nonconjData$NGroups <- max(nonconjData$group)

nonConjSamples <- sampling(noconjugateModel, nonconjData, chains = 2, iter=numIts, refresh=-1)
## Chain 1:
## Chain 1: Gradient evaluation took 4.9e-05 seconds
## Chain 1: 1000 transitions using 10 leapfrog steps per transition would take 0.49 seconds.
## Chain 1: Adjust your expectations accordingly!
## Chain 1:
## Chain 1:
## Chain 1:
## Chain 1:  Elapsed Time: 0.388337 seconds (Warm-up)
## Chain 1:                0.393067 seconds (Sampling)
## Chain 1:                0.781404 seconds (Total)
## Chain 1:
## Chain 2:
## Chain 2: Gradient evaluation took 4.1e-05 seconds
## Chain 2: 1000 transitions using 10 leapfrog steps per transition would take 0.41 seconds.
## Chain 2: Adjust your expectations accordingly!
## Chain 2:
## Chain 2:
## Chain 2:
## Chain 2:  Elapsed Time: 0.303014 seconds (Warm-up)
## Chain 2:                0.343225 seconds (Sampling)
## Chain 2:                0.646239 seconds (Total)
## Chain 2:
plot_lambdas(nonConjSamples)
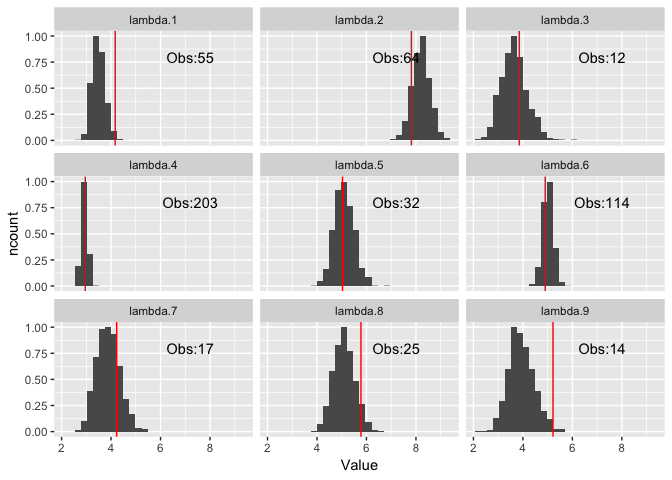
The correct parameters have been recovered.
graph_hyper_parmas(nonConjSamples, seq(0, 8, by=0.01))
The prior distribution prior distribution has also been recovered with similar accuracy to the conjugate model. The only difference is in running time. The nonconjugate model took almost twice as long.
So if you can exploit conjugacy in your model you might see some speed benefits.
Footnotes
1 It probably isn’t uninformative. When you sample from the posterior model without any data you will get some weird results as the prior distribution blows up around 0. But in this example we don’t have to be concerned with that issue.