Double Machine Learning - An Easy Introduction
This post serves as an introduction to the technique of double machine learning. I replicate an influential paper in R and show how you can use machine learning techniques to help untangle causal effects in data.
Enjoy these types of posts? Then you should sign up for my newsletter.
Double machine learning sounds fancy but has the danger of being dismissed as just another buzzword. In fact I think it is an important framework to learn and can help solve inference in causal problems.
In a causal problem there are 3 groups of variables you are considering:
- The covariates. How can you describe each item?
- The treatment. What did you do to each item?
- The response. What you are measuring in response to the treatment.
In a medical context, the covariates might be age, weight and height of a patient. These variables are descriptive that will have an effect on the response, but are not the main focus. The treatment is what we are interested in and could be a binary variable, did they have a vaccine or not? Or it might be a measure of something, i.e. In milligrams how much paracetamol did they have? The response is the main variable we are interested in and want to know how it responds to a treatment, i.e. how quickly did they recover.
Causal analysis is easy to conceptualise in the medical context, but is used across many different disciplines. Economists use it and that’s what this blog post will detail, a walk through and replication of a double machine learning paper:
There are two other influential blog posts that helped me compose this one:
- https://insightr.wordpress.com/2017/06/28/cross-fitting-double-machine-learning-estimator/
- http://aeturrell.com/2018/02/10/econometrics-in-python-partI-ML/
However, both of these tutorials deal with synthetic data that they generate themselves. In this post I will be applying double machine learning to a proper dataset and replicating the above paper.
As a sidenote, double machine learning has been on my radar since hearing Matt Taddy mention the framework in his keynote at R-Finance 2019 in Chicago (back when I travelled beyond the sofa and kitchen).
401k Data
Firstly, we need to find the same data that the paper used. After a
quick Google I find that the hdm package has the 1991 Survey of Income
and Participation data nicely wrapped up in the variable pension. Now
we can map what our response, treatment and covariates are from their
description in the paper and their columns in the data.
treatment <- c("e401")
response <- c("net_tfa")
xActual <- c("age", "inc", "fsize", "educ", "pira", "hown", "marr", "db", "twoearn")
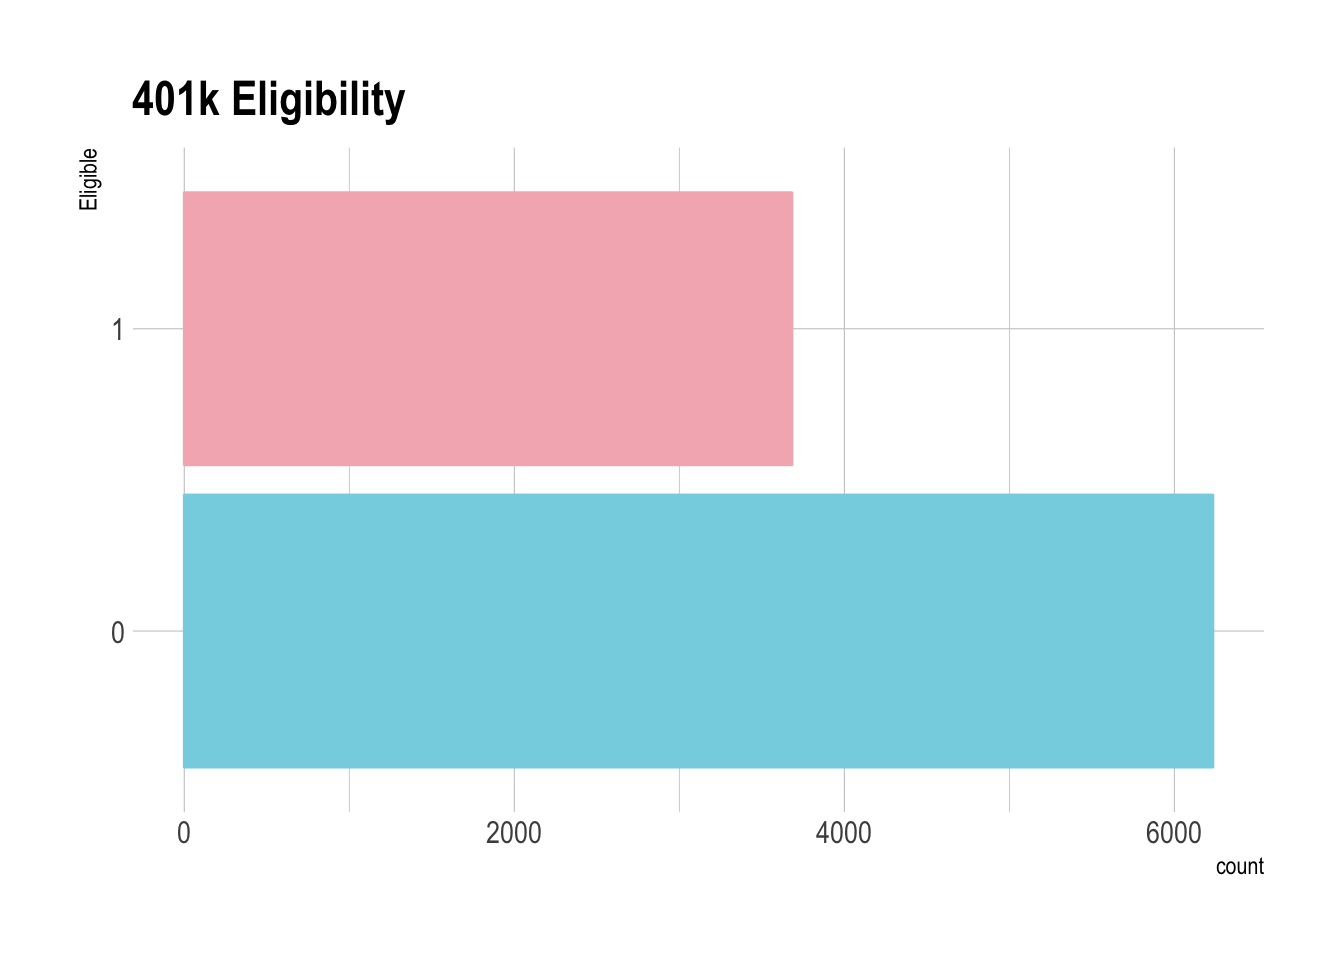
- Treatment:
e401a binary variable that represents a persons eligibility for a 401k plan.
ggplot(pension, aes(x=factor(e401))) +
  geom_bar() +
  coord_flip() +
  ggtitle("401k Eligibility")
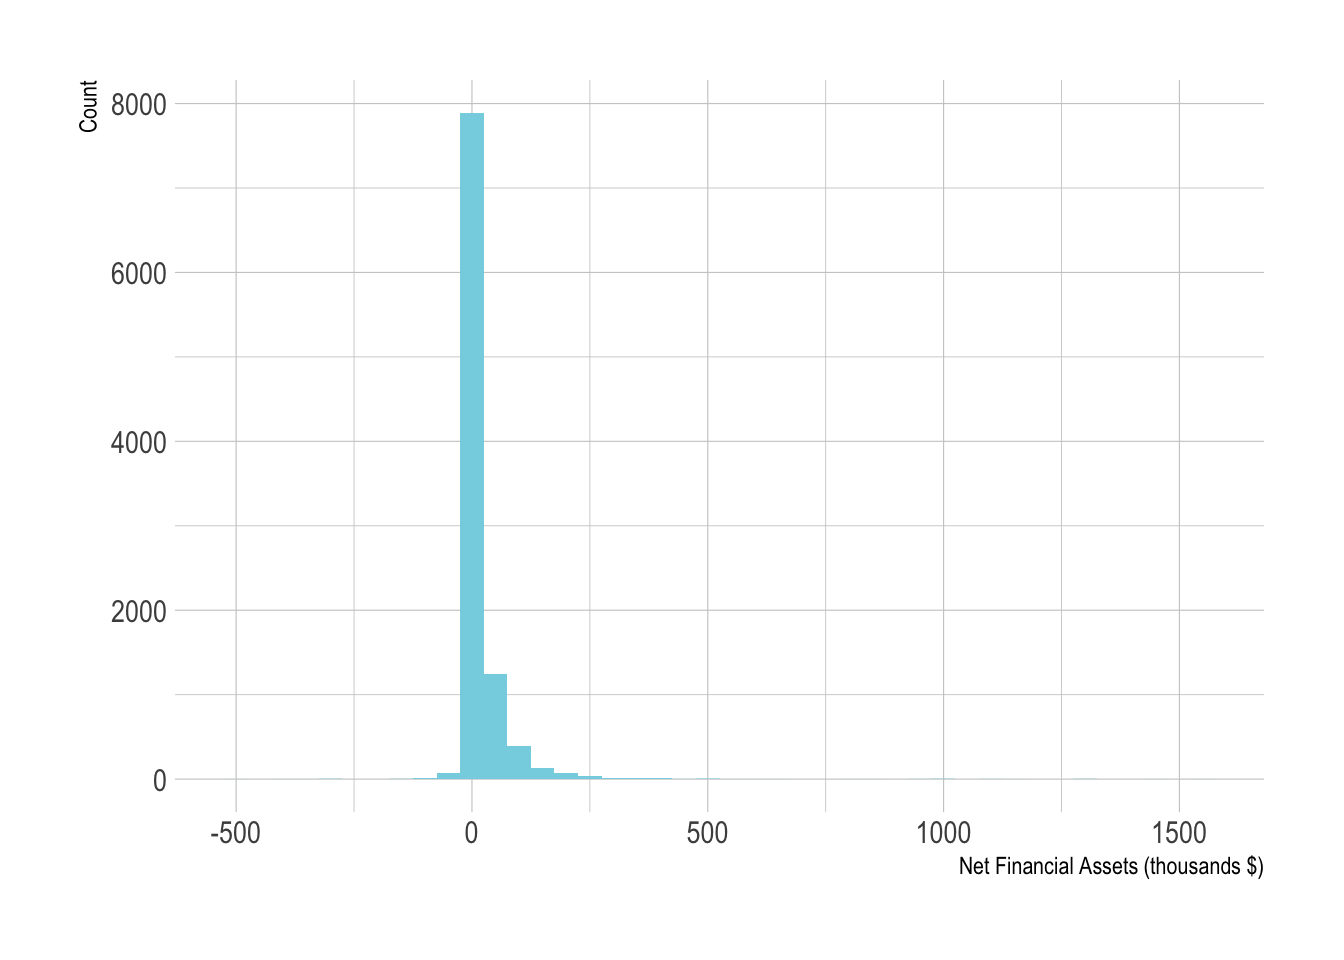
- Response:
net_tfaa positive or negative numerical outcome that shows the net financial assets of a person.
ggplot(pension, aes(x=net_tfa/1e3)) +
  geom_histogram(binwidth=50) +
  xlab("Net Financial Assets (thousands $)") +
  ylab("Count")
- Covariates
ageincincomefsizefamily sizeeducyears of educationpiraparticipation in a IRAhownHome ownership statusmarrMarriage statusdbDefined benefit pensiontwoearnTwo earning household.
ggplot(pension %>%
         select(age, inc, fsize, educ,
                pira, hown, marr, db, twoearn) %>%
       gather(Covariate, Value),
       aes(x=Value)) +
  geom_histogram() +
  facet_wrap(~Covariate, scales="free")
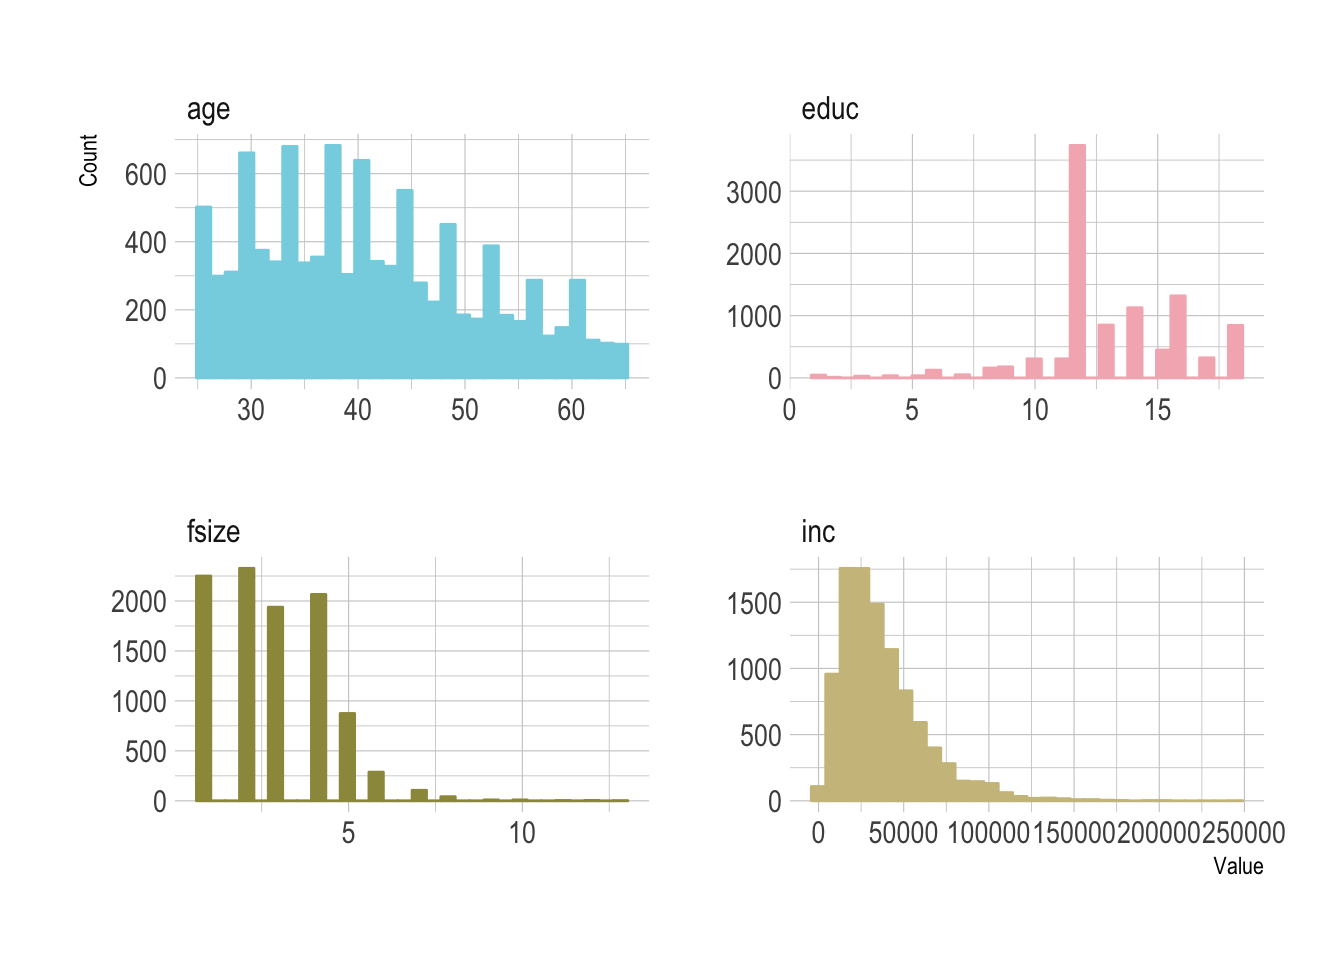
A mixture of binary and continuous variables that we will use in the double machine learning. We can pull just these variables out into a specific dataframe that’ll help us write the fitting functions.
pension %>%
  select(net_tfa,
         e401,
         age, inc, fsize, educ,
         pira, hown, marr, db, twoearn) -> modelData

modelData %>% mutate(e401F = factor(e401, levels = c(0, 1))) -> modelData
Double machine learning is an attempt to understand the effect a treatment has on a response without being unduly influenced by the covariates. We want to try and isolate the effects of a treatment and not an of the other covariates. The method happens with a number of steps as follows:
- Split the data into two sets.
- For each data set model the response based on the covariates.
- For each data set model the treatment based on the covariates.
- Calculate the response residuals.
- Calculate the treatment residuals.
- Regress the response residuals on the treatment residuals to get the treatment effect.
The “double” comes from building the two models, one for the response and one for the treatment. By splitting the dataset into two different partitions and using the partitions to build the models we can come up with a more efficient estimator of the treatment effect. Throughout this post I’ll refer to \(\theta\) as the treatment effect.
Step 1: Split the data into two sets
This step is simple, sample half the indices and use that to form two datasets.
inds <- sample.int(nrow(modelData), nrow(modelData)/2, replace=F)

dataList <- list(modelData[inds, ],
                 modelData[-inds, ])
Steps 3 and 3: Model the Response and Treatment
Using the caret interface we model the response variable, net_tfa
based on the covariates from the paper. We are using the ranger package
to build a random forest. For choosing the hyperparmameters we use 10
fold cross validation and exploit the adaptive features from caret. We
will throw away any model that isn’t great early on to try and save time
and also run this in parallel so help speed things along.
train_control <- trainControl(method="adaptive_cv",
                                               number=10,
                                               search = "random",
                                               verboseIter = TRUE)

rfResponseModel <- lapply(dataList,
                          function(x) train(net_tfa ~ . - e401 - e401F,
                                            method = "ranger",
                                            tuneLength = 10,
                                            data = x,
                                            verbose = T,
                                            trControl = train_control))

rfTreatmentModel <- lapply(dataList,
                           function(x) train(e401F ~ . - net_tfa - e401,
                                             method="ranger",
                                             tuneLength = 10,
                                             data = x,
                                             verbose = T,
                                             trControl = train_control))
We now have the model objects saved and can progress onto the calculation.
Calculating the Residuals and Doing the Calculations
It’s easier in this case to comment the code on what each step is doing:
calc_theta <- function(dataList, responseModel, treatmentModel){

  # Predict the response in dataset 1 (2) using model 2 (1).
  responsePredictions <- lapply(list(c(1,2), c(2,1)),
                                function(i) predict(responseModel[[i[1]]],
                                                    dataList[[i[2]]]))
  # Do the same for the treatment model
  treatmentPredictions <- lapply(list(c(1,2), c(2,1)),
                                 function(i) as.numeric(predict(treatmentModel[[i[1]]],
                                                                dataList[[i[2]]])) - 1)
  # Calculate the treatment residuals
  treatmentResiduals <- list(dataList[[2]]$e401 - treatmentPredictions[[1]],
                             dataList[[1]]$e401 - treatmentPredictions[[2]])

  # Calculate the response residuals
  responseResiduals <- list(dataList[[2]]$net_tfa - responsePredictions[[1]],
                            dataList[[1]]$net_tfa - responsePredictions[[2]])

  # Regress the residuals across both datasets
  theta1 <- mean(treatmentResiduals[[1]] %*% responseResiduals[[1]]) / mean(treatmentResiduals[[1]] %*% dataList[[2]]$e401)
  theta2 <- mean(treatmentResiduals[[2]] %*% responseResiduals[[2]]) / mean(treatmentResiduals[[2]] %*% dataList[[1]]$e401)

  # Take the average as our treatment effect estimator
  mean(c(theta1, theta2))
}

calc_theta(dataList, rfResponseModel, rfTreatmentModel)
## [1] 7449.353
Which looks good, in the paper they have values of around 8000, so ours isn’t too far off and can be considered a successful replication.
More Machine Learning Methods
In the paper they use multiple machine learning models to make sure
the results were not biased by using a specific method. So we can repeat the above for different
machine learning methods. Simply switching the method parameter of the
train function.
Now to get an idea of the uncertainty around the parameter, we repeat the splitting and fitting multiple times to come up with an array of the parameters. In the fitting process there are some extra steps. For each machine learning method we want to tune the hyperparameters on the entire dataset. Save those down and use that for each iteration of the fitting. We don’t want to be tuning the hyper parameters with each step as that is liable to over fitting and will also slow the procedure down.
So for every single machine learning model we chose to fit, there are
the tuning function for both the response and treatment model and the
pre-tuned method for calculating θ. Rather than lay them out in this
blog post and have you scrolling through hundreds of lines I’ve cut it
down to just importing the different model types. In short, replace
the method parameter in the train function with gbm and
glmnet for two extra machine learning techniques. Everything stays
the same, which is the beauty of the unified interface in caret.
source("models/dml.R")
source("models/gbm.R")
source("models/glmnet.R")
source("models/rf.R")

glmnetThetas2 <- dml_glmnet(modelData, 100, 10)
rfThetas2 <- dml_rf(modelData, 100, 10)
gbmThetas2 <- dml_gbm(modelData, 100, 10)

thetaFrame <- data.frame(
  RandomForest = rfThetas2,
  GLMNET = glmnetThetas2,
  GBM= gbmThetas2)


thetaFrame %>%
  gather(Model, Theta) -> thetaFrameTidy
Results
Now because the way they fitted their machine learning models, the way I fitted mine and all sorts of other things that could go wrong in between I’m not hoping for a full replication, but something with at least the same order of magnitude. In Table 1 of the paper they highlight their results:
paperResults <- bind_rows(data.frame(Model = "Interactive",
                           Method = c("Random Forest", "Lasso",
                                      "Regression Tree", "Boosting"),
                           Results = c(8133, 8734, 8073, 8405),
                           Error = c(1483, 1168, 1219, 1193)),
                          data.frame(Model = "Partially Linear",
                                     Method = c("Random Forest", "Lasso",
                                                "Regression Tree", "Boosting"),
                                     Results = c(8845, 9314, 8805, 8612),
                                     Error = c(1204, 1352, 1379, 1338)))
paperResults %>% kable
| Model | Method | Results | Error |
|---|---|---|---|
| Interactive | Random Forest | 8133 | 1483 |
| Interactive | Lasso | 8734 | 1168 |
| Interactive | Regression Tree | 8073 | 1219 |
| Interactive | Boosting | 8405 | 1193 |
| Partially Linear | Random Forest | 8845 | 1204 |
| Partially Linear | Lasso | 9314 | 1352 |
| Partially Linear | Regression Tree | 8805 | 1379 |
| Partially Linear | Boosting | 8612 | 1338 |
ggplot(thetaFrameTidy, aes(x=Theta, fill=Model, colour=Model)) +
  geom_density(alpha=0.5) +
  geom_vline(xintercept = c(8133, 9314)) +
  theme(legend.position = "bottom", legend.title = element_blank())
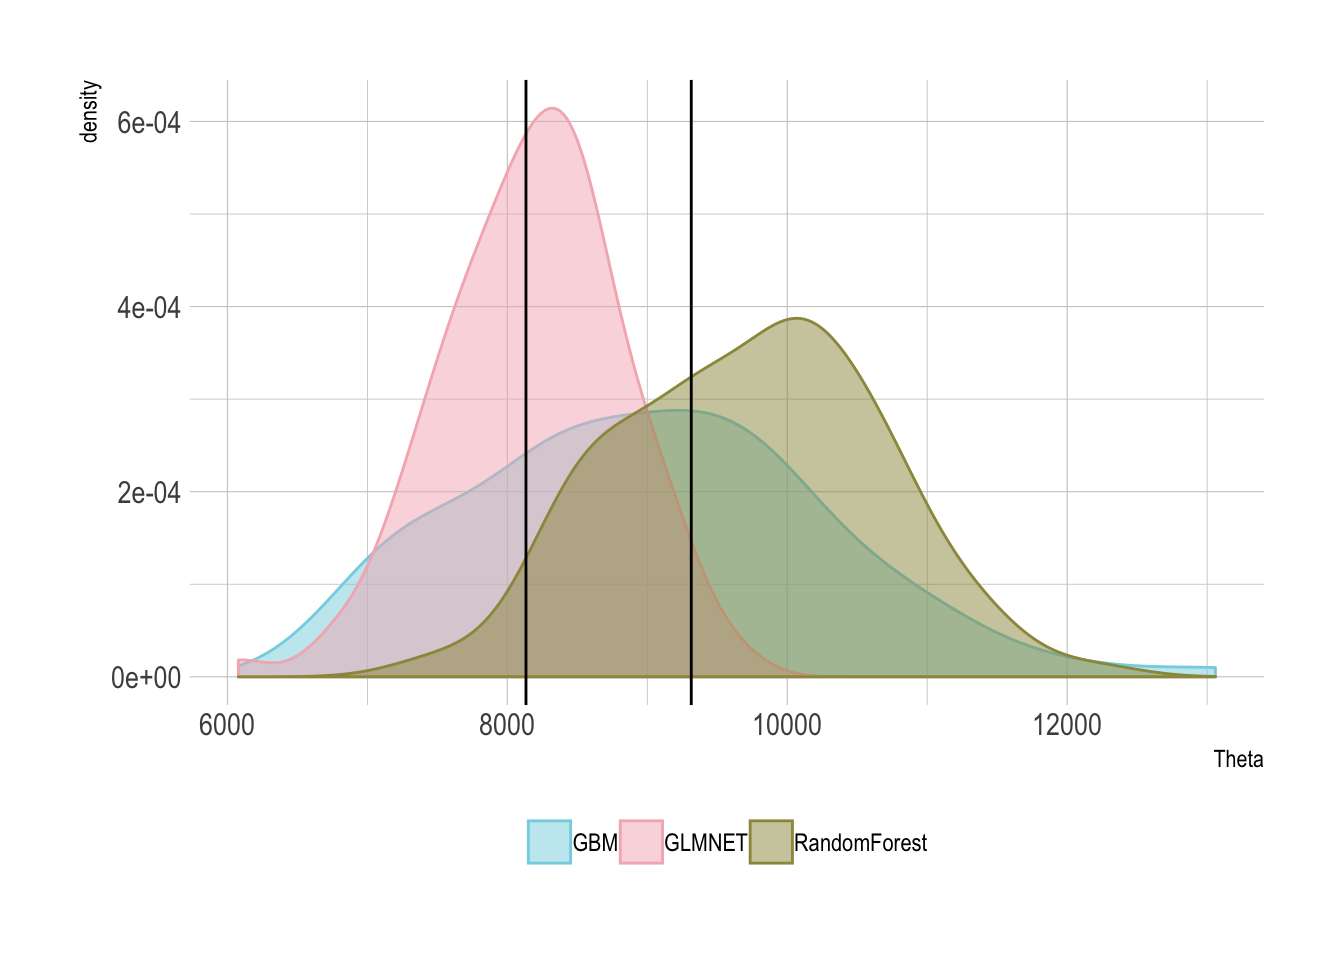
I’ve added in two solid lines which represents the original papers lowest and highest average value from their methods. As you can see we are in the right order of magnitude, so can safely conclude that this method is correct. So whilst the other two double machine learning tutorials have been on synthetic data, this closes the loop and applies it to a proper dataset, successfully recreating a previous study. So go forth, use what you have learnt and do some double machine learning.
Practically, I actually used this in a research piece in my day job and looked at the causal effects of using a limit price on an algo execution.
Session Setup
require(hdm)
require(caret)
require(parallel)
require(dplyr)
require(tidyr)
require(readr)
require(knitr)
require(hrbrthemes)
theme_set(theme_ipsum())
extrafont::loadfonts()
require(wesanderson)
library(doParallel)
cl <- makePSOCKcluster(2)
registerDoParallel(cl)