Dirichlet Process Cluster Probabilities
I recently had a question from a user of my R package
dirichletprocess about calculating the cluster
assignment probabilities of each datapoint. Now this is an interesting
problem when using a Dirichlet process to cluster data and in this
blog post I’ll outline how this can be accomplished.
Enjoy these types of posts? Then sign up for my newsletter.
When we fit a Dirichlet process to the data, we make use of the Chinese restaurant analogy each datapoint is assigned its cluster based on the popularity of each existing cluster. Plus there is also a chance that the datapoint forms its own unique cluster. In restauranteur terms: each data point joins a table based on how popular that table is, plus there is a possibility that the datapoint sits at its own table.
So given that we have a fitted Dirichlet process, how do we calculate the
assignment probabilities of each datapoint? Let’s use the faithful
dataset as our example.
To follow along download my dirichletprocess R package, available on CRAN or
at https://cran.r-project.org/package=dirichletprocess.
faithfulTrans <- scale(faithful)
dp <- DirichletProcessMvnormal(faithfulTrans)
dp <- Fit(dp, 2500, progressBar = FALSE)
plot(dp)
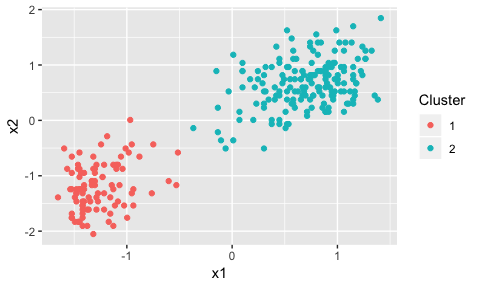
There are obviously two clusters from the plot, but, there are some points in the middle of the graph that could conceivably be part of either cluster.
plot(dp) + geom_circle(data=NULL, aes(x0=-0.1,y0=-0.35, r=0.215), inherit.aes = F)
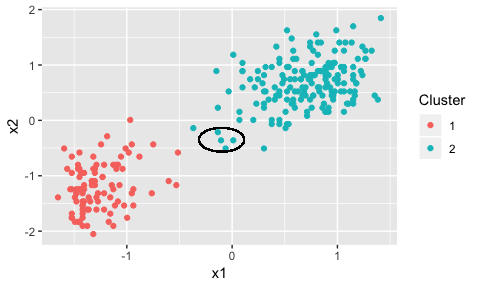
Here we’ve circled the potential points using the ggforce package. These points could be part of either cluster.
Now, we want to calculate the probabilities for each datapoint belonging to each cluster plus, we must include the probability that each datapoint forms its own cluster.
We start by initialising the matrix with enough rows for each data point
and n+1 columns for each probability.
numClusters <- dp$numberClusters
clusterLabelProbs <- matrix(nrow=nrow(faithfulTrans), ncol=numClusters + 1)
For each point we remove it from the pointsPerCluster variable,
calculate the probability density of that cluster weighted by the number
of other points in that cluster. For the probability of the
datapoint forming its own cluster, we multiply the value of \(\alpha\) by
the predicative distribution of the prior.
for(i in seq_len(nrow(faithfulTrans))){

  pointsPerCluster <- dp$pointsPerCluster

  pointsPerCluster[dp$clusterLabels[i]] <- pointsPerCluster[dp$clusterLabels[i]] - 1

  clusterLabelProbs[i, 1:numClusters] <- pointsPerCluster * dirichletprocess:::Likelihood.mvnormal(dp$mixingDistribution, faithfulTrans[i, ,drop=FALSE], dp$clusterParameters)
  clusterLabelProbs[i, numClusters+1] <- dp$alpha * dp$predictiveArray[i]

}

# Normalise the probabilities

t(apply(clusterLabelProbs, 1, function(x) x/sum(x))) -> clusterLabelProbsNorm
We do some fiddling to get the row numbers of the 4 points in question.
faithfulTrans %>%
  as.data.frame %>%
  mutate(RowInds = seq_len(nrow(.))) %>%
  filter(eruptions > -0.3,
          eruptions < 0.1,
          waiting > -0.6,
          waiting < 0) %>%
  pull(RowInds) -> rowInds

data.frame(faithfulTrans, Label=0) -> faithfulTransF
faithfulTransF[rowInds, ]$Label <- 1

ggplot(faithfulTransF, aes(x=eruptions, y=waiting, shape=as.factor(Label), colour=as.factor(dp$clusterLabels))) + geom_point() + guides(colour=FALSE, shape=FALSE)
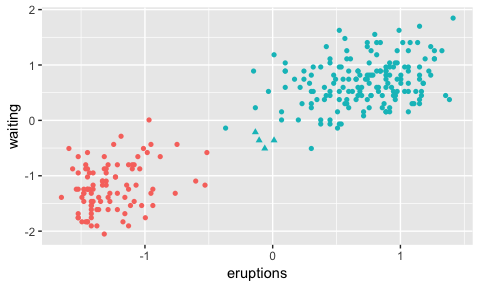
By changing the shape of our concerned datapoints we can see that we’ve got the correct row numbers out.
Now using these row indexes, we can look at the cluster probabilities.
clusterLabelProbsNorm[rowInds, ] %>% kable(format="html", digits = 2)
| 0.07 | 0.92 | 0.01 |
| 0.02 | 0.98 | 0.00 |
| 0.06 | 0.93 | 0.01 |
| 0.07 | 0.92 | 0.01 |
We can see that all the points are most likely to belong to cluster 2. But there is a non-negligible chance that the points could belong to cluster on or even a new cluster. Therefore in the fitting process, there is the slight chance that at each iteration, each point could be assigned to cluster one or form a new cluster.
This hallmarks one of the features of clustering using a Dirichlet process. Given a fitted Dirichlet process object we can easily extract the cluster labels and thus calculate the cluster assignment probabilities. It also helps explain the Chinese restaurant analogy and we can better understand how each datapoint is assigned to a cluster. It looks like these points in question are not forming their own cluster because of the popularity of cluster two. If there was less data in the upper right hand side of the graph, the probability of the 4 points forming their own cluster would be higher.
So overall, doing this calculation is easy given that we have a fitted
Dirichlet process object. The relevant information is contained in the
dp object and its takes just a few functions to extract the
probabilities. Thanks to the user for the question and for the reader
for reaching the end of this post!