Dirichlet Process Convergence
The most frequent question I’m asked about my Dirichlet process package is how to know whether it has converged to a meaningful result. In this blog post I’ll outline how you can assess convergence in a Dirichlet process model.
knitr::opts_chunk$set(warning = FALSE, message = FALSE)
require(dirichletprocess)
require(ggplot2)
require(dplyr)
require(tidyr)
numIts <- 1000
As our example we are going to cluster the waiting time and eruption
lengths of the faithful geyser. This is a standard dataset in R and so
download my package and you can play along too!
Enjoy these types of posts? Then sign up for my newsletter.
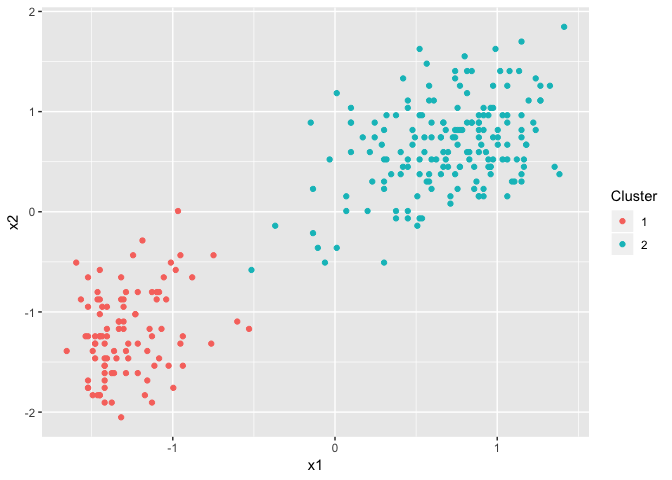
To start with, we fit the default multivariate Dirichlet process model to the data and run the inference for 1000 iterations. The results are show in here:
faithfulTrans <- scale(faithful)
dp <- DirichletProcessMvnormal(faithfulTrans)
dp <- Fit(dp, numIts)
plot(dp)
The issue of convergence is essentially asking, can we trust this fit, or is just statistical noise? Well one easy way to verify this is to run the process again, but with different initial cluster allocations.
By default, the Dirichlet process package starts the fitting process
with every datapoint in one cluster. We can change that using the
numInitialClusters argument to set the number of initial clusters
to a higher number, in this case, each datapoint is now in a separate
cluster. We run the fitting process for the same amount of
iterations.
dp2 <- DirichletProcessMvnormal(faithfulTrans,
                               numInitialClusters = nrow(faithfulTrans))
dp2 <- Fit(dp2, numIts)
plot(dp2)

We’ve now got two Dirichlet process results and wish to judge whether they have come to the same conclusion. Visually, it looks like they have, the data has been separated into two main clusters. But is this an actual feature of the data, or is it just statistical noise?
We use a trace plot of the alpha parameter and see if the two dirichlet process objects are inferring a similar value. Alpha is the parameter that controls how many clusters there are in the data, so if one fit has an alpha of 10 and the other an alpha of 0.2 then we know something is up.
alphaFrame <- data.frame(Chain1 = dp$alphaChain, Chain2 = dp2$alphaChain, Iter=seq_len(numIts))
alphaFrame %>% gather(Chain, Value, -Iter) -> alphaFrameTidy
ggplot(alphaFrameTidy, aes(x=Iter, y=Value, colour=Chain)) + geom_line()
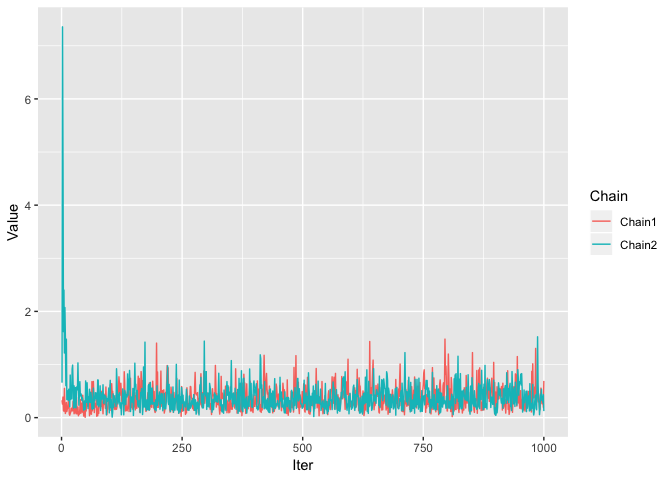
Here we can see that the Dirichlet process is sampling nicely around similar values for both chains, which suggests that the above result of the two major clusters is a maximum point of the likelihood. Also note that the second chain starts with a large value of alpha because of the larger amount of clusters that the sampling started with.
We can also take it another step further and use the Gelman Rubin
diagnostic to assess this convergence. This is a standard method of
looking at the variance between two chains at different sections of
the fitting process to see when there is enough reduced variance to
conclude that the chains are iterating around similar values. From my
package it is easy to extract out the chains and use the function from
the coda package to calculate the value. You even get a nice graph.
require(coda)

chains <- mcmc.list(mcmc(cbind(Alpha = dp$alphaChain)),
                    mcmc(cbind(Alpha= dp2$alphaChain)))

gelman.plot(chains)
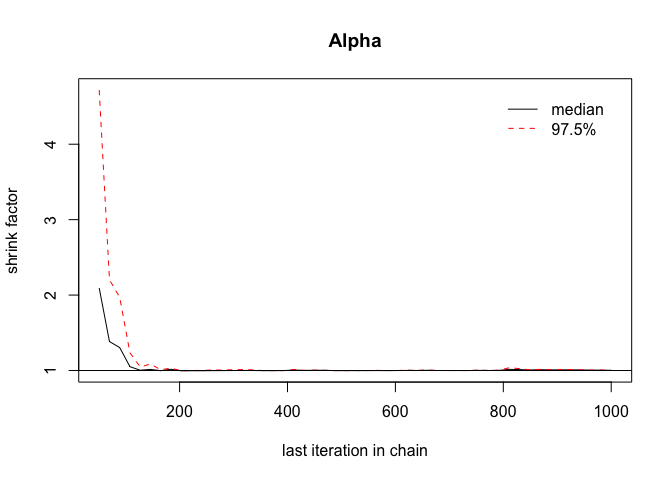
Here we can see that the values of the diagnostic function are very close to one, which shows that the variance between the paramter chains is similar. We want to aim for a value of less than 1.1, which in this case is easily achieved.
The alpha parameter is not the only parameter to consider. There is also the actual number of clusters that the Dirichet process finds and the overall likelihood of the model. We can easily add these to the above coda object and assess their convergence.
numClusters <- vapply(dp$weightsChain, function(x) length(x), numeric(1))
numClusters2 <- vapply(dp2$weightsChain, function(x) length(x), numeric(1))

chains <- mcmc.list(mcmc(cbind(Alpha = dp$alphaChain,
                               NumClusters = numClusters,
                               Likelihood = dp$likelihoodChain)),
                    mcmc(cbind(Alpha= dp2$alphaChain,
                               NumClusters = numClusters2,
                               Likelihood = dp2$likelihoodChain)))

gelman.plot(chains)
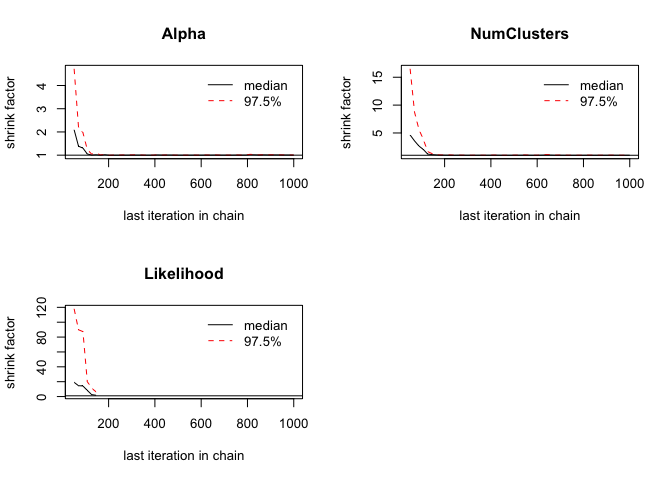
Again, the diagnostic plots in this case show that all three of the
values sampled from each chain have converged, which is what we were
hoping for. Therefore, we can reasonably assume that the faithful
dataset has the two clusters that was identified.
This blog post has outlined how you might go about checking whether a Dirichlet process has converged. It is by no means an exhaustive check, but the first things I look for when fitting a Dirichlet process model.