Expected Goals - Overachieving or just lucky? An Update
My previous post on expected goals in September received a good reception, so I’ve decided to keep on top of the model and provide an interactive way of keeping you up-to-date with what teams are outperforming the pre and post match model. I’ve also sharpened up the visualisations this time and replaced the points and labels with each teams crests.
Enjoy these types of posts? Then sign up for my newsletter.
If you just want to see some results, check out my new shiny app that will be kept up to date with the model and how teams are performing.
If not, here is a refresher and quick summary of my previous post. Firstly, I built two models:
- Using the odds of the teams before the match starts, can we predict how many goals they are going to score? The prematch model.
- Using the number of shots, shots on target, corners and red cards how many goals did they score? The postmatch model.
The prematch model measures the betting markets belief of how strong a team is going to perform. The post match model estimates how ‘lucky’ they were or how well they converted shots into goals. Then for each model and match played we can calculate the spread between the predicted number of goals and actual number of goals to measure if they are outperforming or underperforming either model.
- Prematch spread: how many goals you scored compared to the bookmakers expected number of goals. Positive - you scored more, negative you scored less.
- Postmatch spread: how many goals you scored compared to the expected number of goals from the total number of shots, corners etc. Again, postive you scored more, negative you scored less than expected.
Both measures give some sort of measure of luck and team performance. So we can use a quadrant plot to visualise a teams performance over a season, or in this case, in the current season so far.
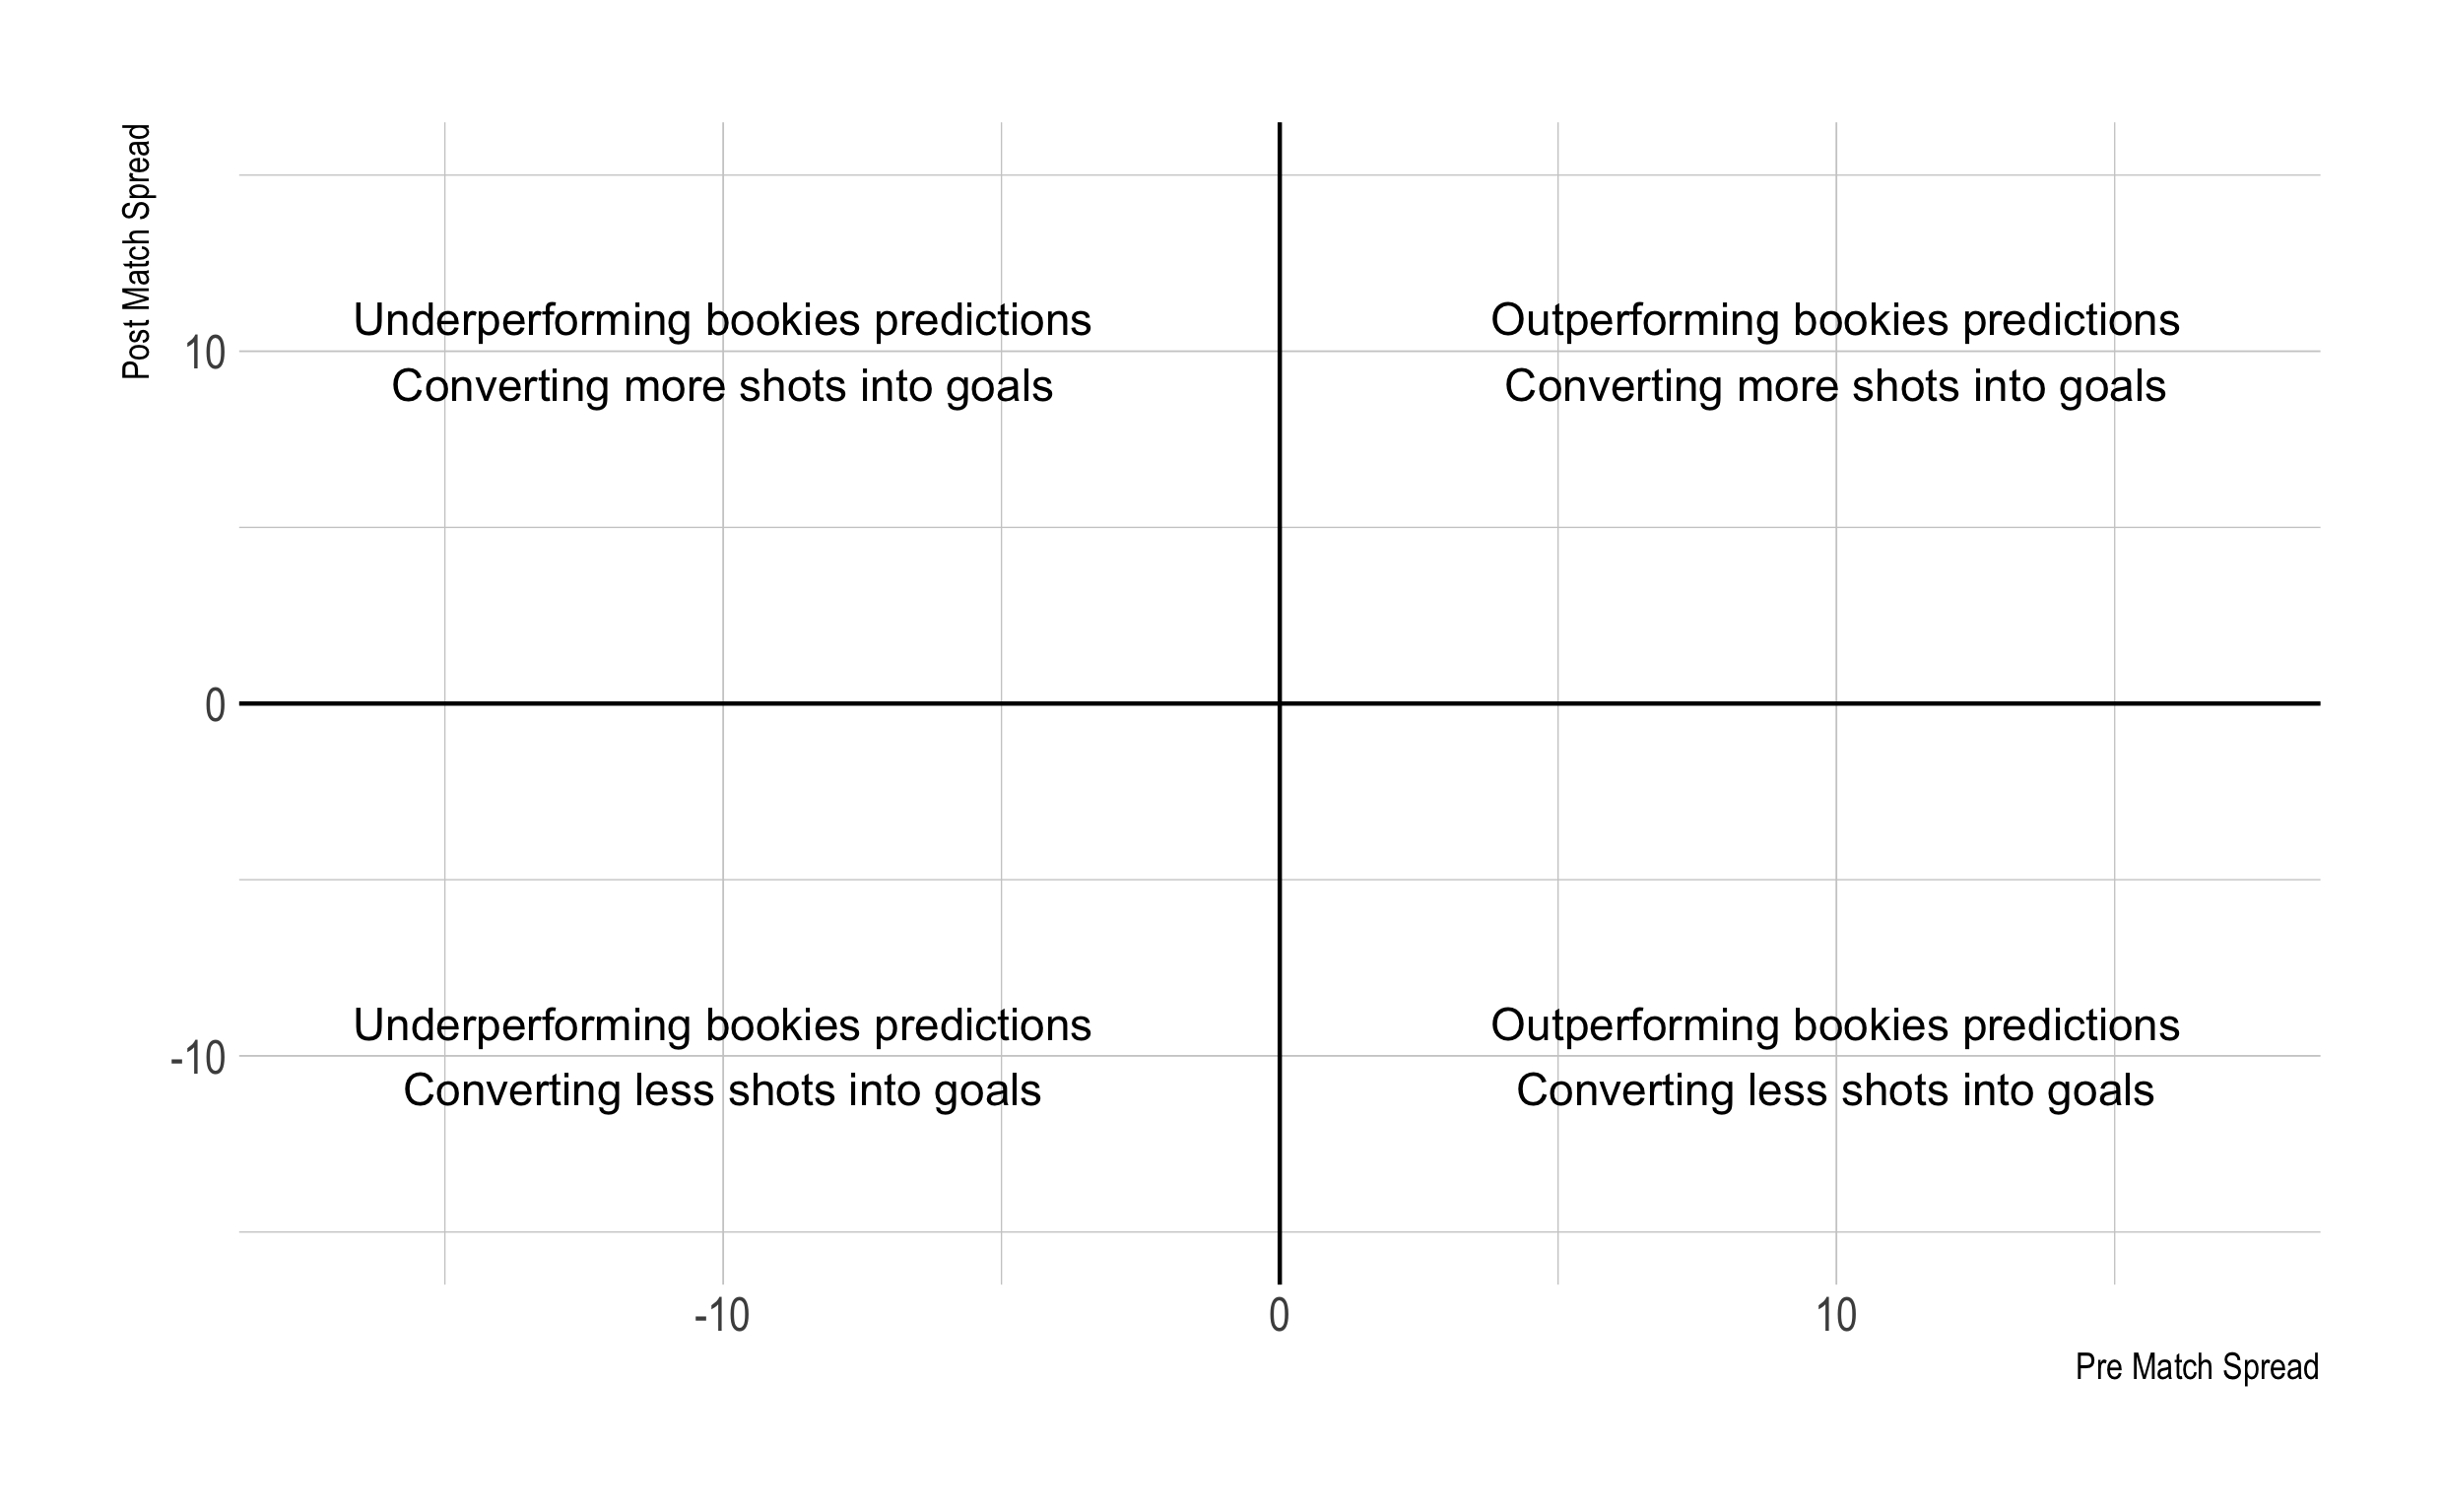
So you want your team to be in the right hand quadrant, that they outperform both measures. You don’t want to be in the bottom left quadrant, not converting shots into goals and consistently underperforming what the bookies think you should be scoring.
The Premier League So Far
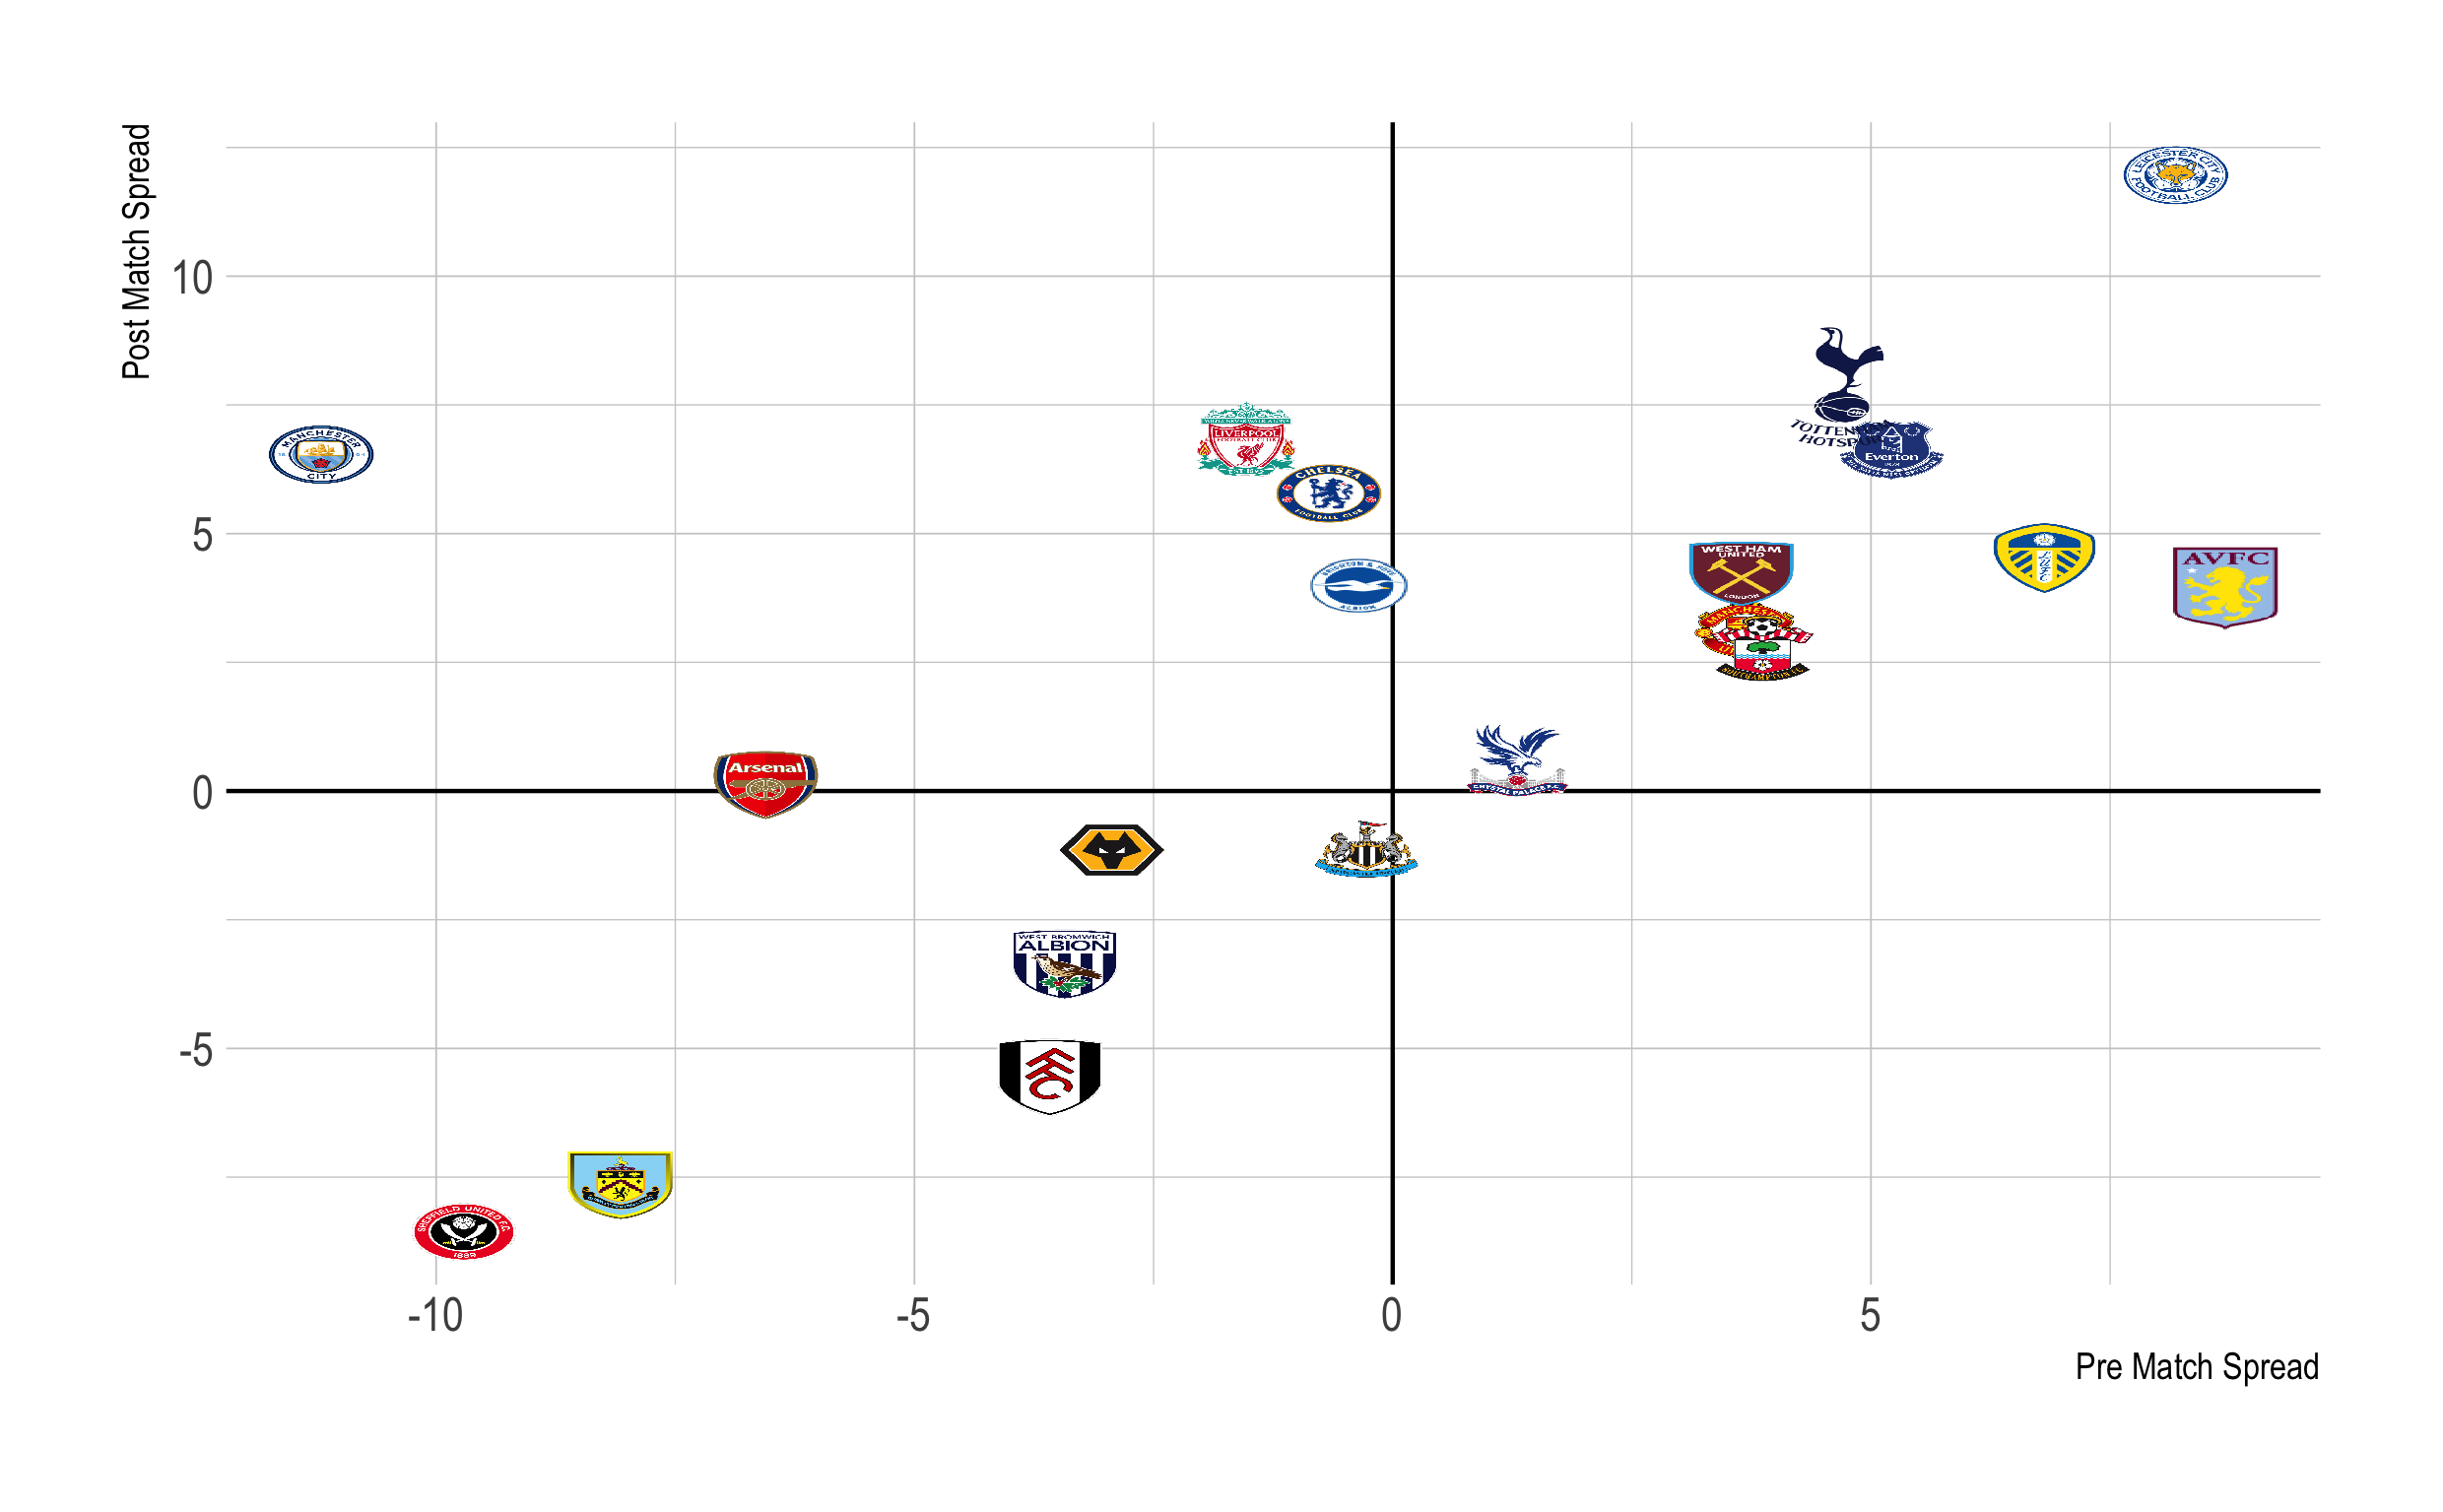
So now we know what we are looking at, how has everyone performed in this fan-free season?
A couple of stand out features.
-
Man City under performaning the bookies expectation more than everyone else! But doing well in the post match model. This just shows they haven’t been as strong as the market expected in each match but are still able to score goals.
-
Arsenal are underperforming the prematch spread, but roughly level for the post match spread. This shows that they haven’t been particularly unlucky instead they are just not generating enough shots to lead to goals. This seems to fit the current narrative and should worry any Arsenal fan.
-
Burnley in the model danger zone. Whilst they aren’t in the actual relegation zone they could slip down soon.
Other Leagues and Other Seasons
I’ve built a shiny app to look back on previous seasons and other European leagues. You can check it out here:
You can see any season from 12/13 onwards across the English, Scottish, Italian, Dutch, Spanish and French leagues. When you look at La Liga for this current season Real Madrid and Barcelona both have negative prematch spreads.
You’ll also notice I’ve replaced dots and labels with team crests for some leagues. I’ll post a tutorial soon how to do that in R (and maybe Python too if I’m able to work out how to do it!).