Alpha Capture and Acquired
People are never short of a trade idea. There is a whole industry of researchers, salespeople and amateurs coming up with trading ideas and making big calls on what stock will go up, what country will cut interest rates and what the price of gold will do next. Alpha capture is about systematically assessing ideas and working out who has alpha and generates profitable ideas and who is just making it up as they are going along.
Enjoy these types of posts? Then you should sign up for my newsletter.
Alpha capture started as a way of profiling a broker’s stock recommendation. If you have 50 people recommending you 50 different ideas, how do you know who is good? You’ll quickly run out of money if you blindly follow all the recommendations that hit your inbox. Instead, you need to profile each person’s idea and see who on average can make good recommendations. Whoever is good at picking stocks probably deserves more of your business.
It has since expanded that some hedge fund have internal desks that are doing a similar analysis on their portfolio managers (PMs) to double down on profitable bets and mitigate risks of all the PMs picking the same stock. Picking stocks and managing a portfolio across many PMs are two different skills and different departments at your modern hedge fund.
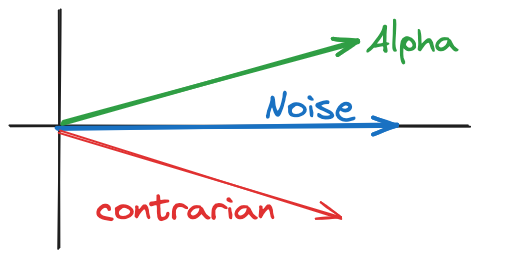
A simple way to measure the alpha of a PM or broker recommendation will be to see if the price of a stock they buy (or recommend) goes up after the day they suggest it. Those with alpha would see their picks move higher on a large enough sample and those without alpha would average out to zero, some ideas would go higher, some ideas lower, the net result being 0 alpha. If a PM has the opposite effect, every stock they buy goes down they are a contrarian indicator so take their idea and do the opposite!

Alpha Capture Systems: Past, Present, and Future Directions goes through the history of alpha capture and is a good short read that inspired this blog post.
Basic Alpha Capture
What if we wanted to try our own Alpha Capture? We need some stock recommendations and a way of calculating what happens to the price after the recommendation. This is where the Acquired podcast comes in.

Acquired tells the stories and strategies of great companies (taken from their website). It’s a pretty popular podcast and each episode gets close to a million listeners. So this makes it an ideal Alpha Capture study - when they release an episode about a company does the stock price of that company go higher or lower on average? If it were to go higher then each time an episode is released call your broker and go long the stock!
They aren’t explicitly recommending a stock by talking about it, as they say in their intro. So it’s just a toy exercise to see if there is any correlation between the stock price and the release date of an episode.
To systematically test this we need to get a list of the episodes and calculate a ‘markout’ from each episode.
Collecting Podcast Data
The internet is a wonderful thing and each episode of Acquired is available as a XML feed from transistor.fm. So doing some fun parsing of XML I can get the full history of the podcast with each date and title.
function parseEpisode(x)
  rawDate = first(simplevalue.(x[tag.(x) .== "pubDate"]))
  date = ZonedDateTime(rawDate, dateformat"eee, dd uuu yyyy HH:MM:ss z")

  Dict("title" => first(simplevalue.(x[tag.(x) .== "title"])),
       "date" =>date)
end

function parse_date(t)
   Date(string(split(t, "T")[1]))
end

url = "https://feeds.transistor.fm/acquired"

data = parse(Node, String(HTTP.get(url).body))

episodes = children(data[3][1])
filter!(x -> tag(x) == "item", episodes)
episodes = children.(episodes)

episodeData = parseEpisode.(episodes)

episodeFrame = vcat(DataFrame.(episodeData)...)
CSV.write("episodeRaw.csv", episodeFrame)
After writing the data to a CSV I need to somehow parse the episode title into a stock ticker. This is a tricky task as the episode names are human friendly not computer friendly. So time for our LLM overlords to lend a hand a do the heavy lifting. I drop the CSV into Perplexity and prompt it to add the relevant stock ticker to the file. I then reread the CSV into my notebook.
episodeFrame = CSV.read("episodeTicker.csv", DataFrame)
episodeFrame.date = ZonedDateTime.(String.(episodeFrame.date), dateformat"yyyy-mm-ddTHH:MM:SS.sss-z")

vcat(first(@subset(episodeFrame, :stock_ticker .!= "-"), 4),
        last(@subset(episodeFrame, :stock_ticker .!= "-"), 4))
dateZonedDateTime |
titleString |
stock_tickerString15 |
sector_etfString7 |
|---|---|---|---|
| 2024-03-17T17:54:00.400+07:00 | Renaissance Technologies | RNR | PSI |
| 2024-02-19T17:56:00.410+08:00 | Hermès | RMS.PA | GXLU |
| 2024-01-21T17:59:00.450+08:00 | Novo Nordisk (Ozempic) | NOVO-B.CO | IHE |
| 2023-11-26T16:24:00.250+08:00 | Visa | V | IPAY |
| 2018-09-23T18:28:00.550+07:00 | Season 3, Episode 5: Alibaba | BABA | KWEB |
| 2018-08-20T09:20:00.370+07:00 | Season 3, Episode 3: The Sonos IPO | SONO | GAMR |
| 2018-08-05T18:15:00.030+07:00 | Season 3, Episode 2: The Xiaomi IPO | XIACF | KWEB |
| 2018-07-16T21:40:00.560+07:00 | Season 3, Episode 1: Tesla | TSLA | TSLA |
It’s done an ok job. Most of the episodes seem to correspond to the right ticker but we can see it has hallucinated the RenTech stock ticker as RNR. RenTech is a private company, no stock ticker and instead, Perplexity has decided the RNR (a reinsurance company) is the correct stock ticker. So not 100% accurate. Still, it has saved me a good chunk of time and we can move on to getting the stock price data.
We want to measure the average price move of a stock after an episode is released. If Acquired had stock-picking skill, you expect the price to increase after the release of an episode as they are generally speaking positively about the various companies.
So using AlpacaMarkets.jl we get the stock price for the days before and the days after the episode. As AlpacaMarkets only has US stock data then only some of the episodes end up with a full dataset.
What is a Markout?
We calculate the percentage change relative to the episode date and then aggregate all the stock tickers together.
\[\text{Markout} = \frac{p - p_{\text{episode released}}}{p_{\text{episode released}}}\]Acquired is about great companies so they choose to speak favourably about a company, therefore I think it’s a reasonable assumption that we expect the stock price to increase after everyone gets round to listening to it. So once we aggregate all the episodes we should hopefully have enough data to decide if this is true.
function getStockData(stock, startDate)
  prices = AlpacaMarkets.stock_bars(stock, "1Day", startTime=startDate - Month(1), limit=10000)[1]
  prices.date .= startDate
  prices.t = parse_date.(prices.t)
  prices[:, [:t, :symbol, :vw, :date]]
end

function calcMarkout(data)
   arrivalInd = findlast(data.t .<= data.date)
   arrivalPrice = data[arrivalInd, :vw]
   data.arrivalPrice .= arrivalPrice
   data.ts = [x.value for x in (data.t .- data.date)]
   data.markout = 1e4*(data.vw .- data.arrivalPrice) ./ data.arrivalPrice
   data
end

res = []

for row in eachrow(episodeFrame)

    try
        stockData = getStockData(row.stock_ticker, Date(row.date))
        stockData = calcMarkout(stockData)
        append!(res, [stockData])
    catch e
        println(row.stock_ticker)
    end
end

res = vcat(res...)
With the data pulled we now aggregate by each day before and after the episode.
markoutRes = @combine(groupby(res, :ts), :n = length(:markout),
                                         :avgMarkout = mean(:markout),
                                         :devMarkout = std(:markout))
markoutRes = @transform(markoutRes, :errMarkout = :devMarkout ./sqrt.(:n))
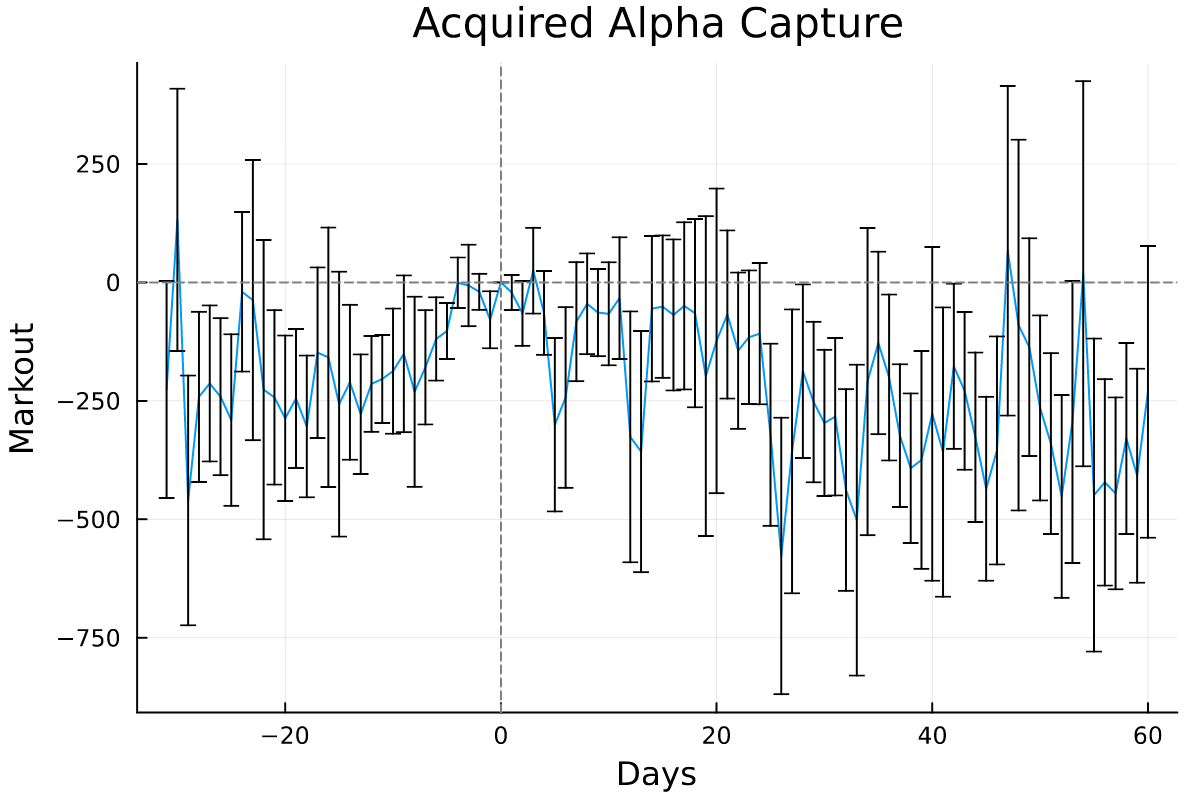
Always need error bars as this data gets noisy.
markoutResSub = @subset(markoutRes, :ts .<= 60, :n .>= 10)
plot(markoutResSub.ts, markoutResSub.avgMarkout, yerr=markoutResSub.errMarkout,
     xlabel = "Days", ylabel = "Markout", title = "Acquired Alpha Capture", label = :none)
hline!([0], ls = :dash, color = "grey", label = :none)
vline!([0], ls = :dash, color = "grey", label = :none)

Not really a pattern. The majority of the error bars are intercepting zero after the podcast is released. If you squint a little bit there seems to be a bit of a downward trend post-episode which would suggest they talk about a company at the peak of the stock price.
Beforehand there is a bit of positive momentum, again suggesting that they release the podcast at the peak of the stock price. Now this is even more of a stretch given there is only 1 podcast a month and it takes more than 20 days to prepare an episode (I imagine!), so more noise than signal.
markoutIndRes = @combine(groupby(res, [:symbol, :ts]), :n = length(:markout),
                                         :avgMarkout = mean(:markout),
                                         :devMarkout = std(:markout))
markoutIndRes = @transform(markoutIndRes, :errMarkout = :devMarkout ./sqrt.(:n))

p = plot()
hline!(p, [0], ls = :dash, color = "grey", label = :none)
vline!(p, [0], ls = :dash, color = "grey", label = :none)
for sym in ["TSLA", "V", "META"]
   markoutResSub = sort(@subset(markoutIndRes, :symbol .== sym, :ts .<= 60, :n .>= 1), :ts)
    plot!(p, markoutResSub.ts, markoutResSub.avgMarkout, yerr=markoutResSub.errMarkout,
     xlabel = "Days", ylabel = "Markout", title = "Acquired Alpha Capture", label = sym, lw =2)
end
p

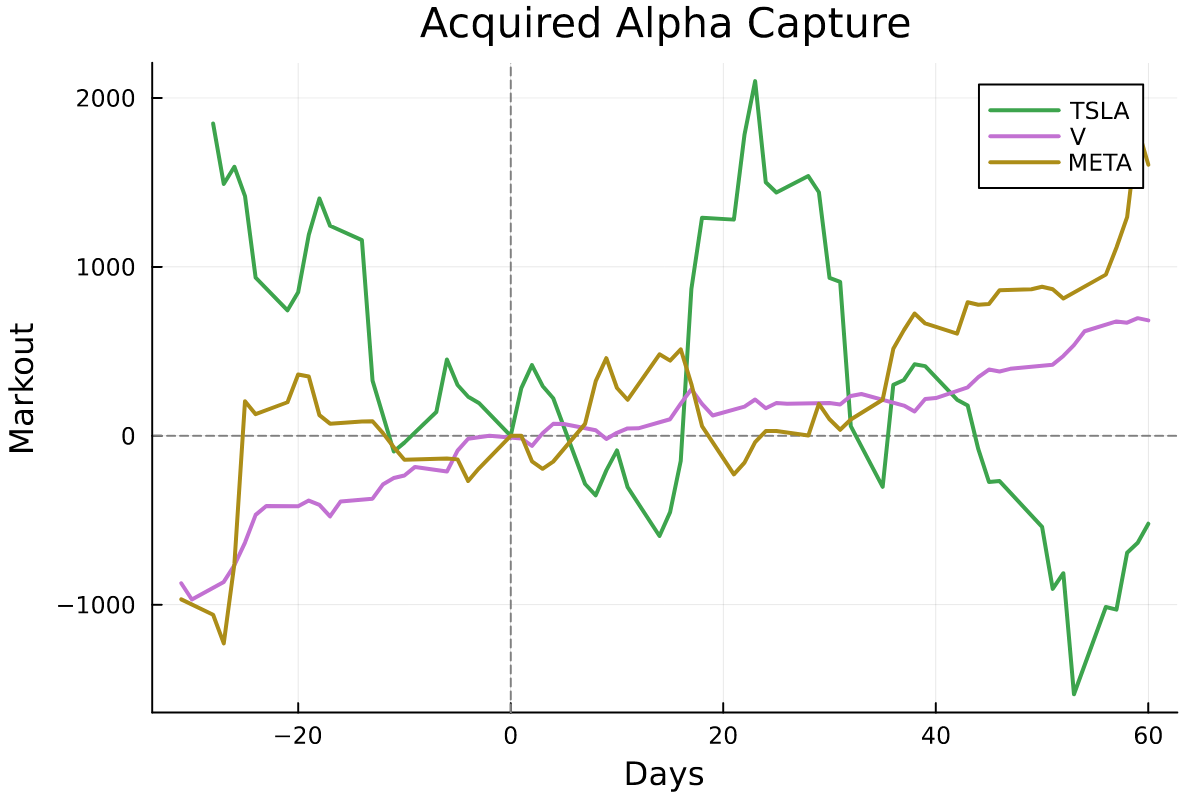
When we pull out 3 examples of episodes we can see the randomness and specifically the volatility of TSLA here.
Conclusion
From this, we would not put any specific weight on the stock performance after an episode is released. There doesn’t appear to be any statistical pattern to exploit. No alpha means no alpha capture. It is a nice exercise though and has hopefully explained the concept of a markout.