Premier League Survival – How Many Points Are Enough?
It’s been an interesting start to the Premier League. All of the promoted teams (Sunderland, Leeds and Burnley) are outside the relegation zone, with Wolves and West Ham struggling at the bottom. So I want to look back at the other seasons and work out the average number of points throughout the season that characterises relegation teams, and how many points do you need to avoid relegation?
Enjoy these types of posts? Then sign up for my newsletter.
This is also a post where I dive into Python. I’ve been meaning to learn both Polars and Plotly, and given the relative simplicity of this post, it feels like the opportune time. It has also been a while since I’ve written about football and given my reduced output recently, it feels like a quick win to churn something out quickly.
Downloading the Data
The gold standard for free and easy football data is football-data, where they have a CSV of every season for many years. This makes it easy to download it directly and merge the seasons together.
Reading a CSV with Polars is no different to Pandas, but adding in a new column is slightly different with the use_columns function and giving it an alias.
s = range(2009, 2027)
seasons = [str((x-1))[2:4] + str((x))[2:4] for x in s]

rawDataList = []

for season in seasons:
    url = f"https://www.football-data.co.uk/mmz4281/{season}/E0.csv"
    rawData = pl.read_csv(url, truncate_ragged_lines=True)
    rawData = rawData.with_columns(pl.lit(season).alias("Season"))
    rawDataList.append(rawData)

rawData = pl.concat(rawDataList, how = "diagonal")
We diagonally concatenate the dataframes because not every season has the same columns, and this will null-fill any missing columns.
We then add a column of row indices and add the points scored by the home and away team based on the outcome of the match.
rawData = rawData.with_row_index("MatchID")
rawData = rawData.with_columns((pl.when(pl.col("FTR") == "H").then(3).when(pl.col("FTR") == "A")).then(0).otherwise(1).alias('PTH'))
rawData = rawData.with_columns((pl.when(pl.col("FTR") == "A").then(3).when(pl.col("FTR") == "H")).then(0).otherwise(1).alias('PTA'))
Formatting the Data
Currently, the data is in a ‘per match’ format with a home and away team. We need to rearrange this so that each team gets its own row per match, so if we filter for a specific team, we get all their matches rather than having to filter both the home and away columns.
The current columns refer to stats in terms of home (H) and away (A). We will replace those names with 1 and 2.
matchDetailsCols = ["MatchID", "Season", "Div", "Date", "HomeTeam", "AwayTeam"]
matchDetailsMap = dict(zip(matchDetailsCols, ["MatchID", "Season", "Div", "Date", "Team1", "Team2"]))

matchStatsCols = ["FTHG", "FTAG", "HS", "AS", "HST", "AST", "PSCD", "PSCH", "PSCA", "PTH", "PTA"]
matchStatsMap = dict(zip(matchStatsCols, [x.replace("H", "1").replace("A", "2") for x in matchStatsCols]))

allCols = matchDetailsCols + matchStatsCols
colsMap = matchDetailsMap | matchStatsMap
matchData = rawData[allCols]
So we create a frame with all the matches relabelled as Team1 and add a dummy indicator for a Home match.
team1Data = matchData.rename(colsMap)
team1Data = team1Data.with_columns(pl.lit(1).alias("Home"))
Likewise for Team2.
team2Data = matchData.rename(colsMap)
team2Map = dict(zip(team2Data.columns, [x.replace("1", "2") if "1" in x else x.replace("2", "1") for x in team2Data.columns]))
team2Data = team2Data.rename(team2Map)
team2Data = team2Data.with_columns(pl.lit(0).alias("Home"))
Then rejoin and sort by the matchID.
teamData = pl.concat([team1Data, team2Data], how = "diagonal")
teamData = teamData.sort("MatchID")
Now we want to add the cumulative sum of points, goals, and goals conceded to get a view of each team’s league position on a match by match basis.
teamData = teamData.select(pl.all(), pl.col("PT1").cum_sum().over(["Season", "Team1"]).alias("TotalPoints1"))
teamData = teamData.select(pl.all(), pl.col("FT1G").cum_sum().over(["Season", "Team1"]).alias("TotalGoals1"))
teamData = teamData.select(pl.all(), pl.col("FT2G").cum_sum().over(["Season", "Team1"]).alias("TotalGoalsC1"))
teamData = teamData.select(pl.all(), pl.int_range(pl.len()).over(["Season", "Team1"]).alias("N"))
This is a bit different to the usual groupby and aggregate, but makes sense to define the function over the column then specify the aggregation columns.
Finally, we are going to create a league table dataframe by taking the last points/goals/goals conceded by each team per season and use that to work out who got relegated each year.
leagueTable = teamData.group_by(["Season", "Div", "Team1"]).agg(pl.col("N", "TotalPoints1", "TotalGoals1", "TotalGoalsC1").last())
leagueTable = leagueTable.sort("TotalPoints1", descending=True)
leagueTable = leagueTable.select(pl.all(), pl.int_range(pl.len()).over(["Season", "Div"]).alias("FinalPosition"))
leagueTable = leagueTable.with_columns((pl.when(pl.col("FinalPosition") >= 17).then(1)).otherwise(0).alias('Relegated'))
We can then join this to the teamData, and this will form the basis of our stats.
teamData = teamData.join(leagueTable[["Season", "Div", "Team1", "FinalPosition", "Relegated"]], on = ["Season", "Div", "Team1"])
Relegation Statistics
The data is in a nice format, and we can manipulate it and see where this season is lining up. This is where plotly now comes in. I’ve always been a matplotlib user and enjoyed building up the plots layer by layer and a decent amount of control. Plotly was always missing from my arsenal, so if I’m dipping my toes into Python, I might as well plug that gap. I’ve neglected some of the final graph formatting points to keep the code chunks manageable.
import plotly.express as px
import plotly.graph_objects as go
from plotly.subplots import make_subplots
First, we calculate the relegation stats. We want to calculate the average number of points, goals scored, and goals conceded after each game week for the teams that were eventually relegated.
relegated = (teamData.filter(pl.col("Season") != "2526")
                     .group_by(["N", "Relegated"])
                     .agg(pl.col("TotalPoints1").mean(),
                          pl.col("TotalGoals1").mean(),
                          pl.col("TotalGoalsC1").mean())
                     .sort("N").filter(pl.col("Relegated") == 1))
We then want to plot this and compare it to the currently promoted teams, plus Wolves and West Ham, who are in the most trouble. Also, shout out to https://teamcolours.netlify.app/ to get the actual colours of the teams for the plot.
fig = go.Figure()
fig.add_trace(go.Scatter(x=relegated["N"], y=relegated["TotalPoints1"],
                    mode='lines+markers',
                    name='Avg Points Of A Relegated Team'))

for team in ["West Ham", "Wolves", "Sunderland", "Leeds", "Burnley"]:
    latestTeam = teamData.filter(pl.col("Team1") == team, pl.col("Season") == "2526")

    fig.add_trace(go.Scatter(x=latestTeam["N"], y=latestTeam["TotalPoints1"],
                    mode='lines+markers',
                    name=team))


fig.update_layout(height=500, width=700,
                  title_text="Relegation Stats")

fig.show()
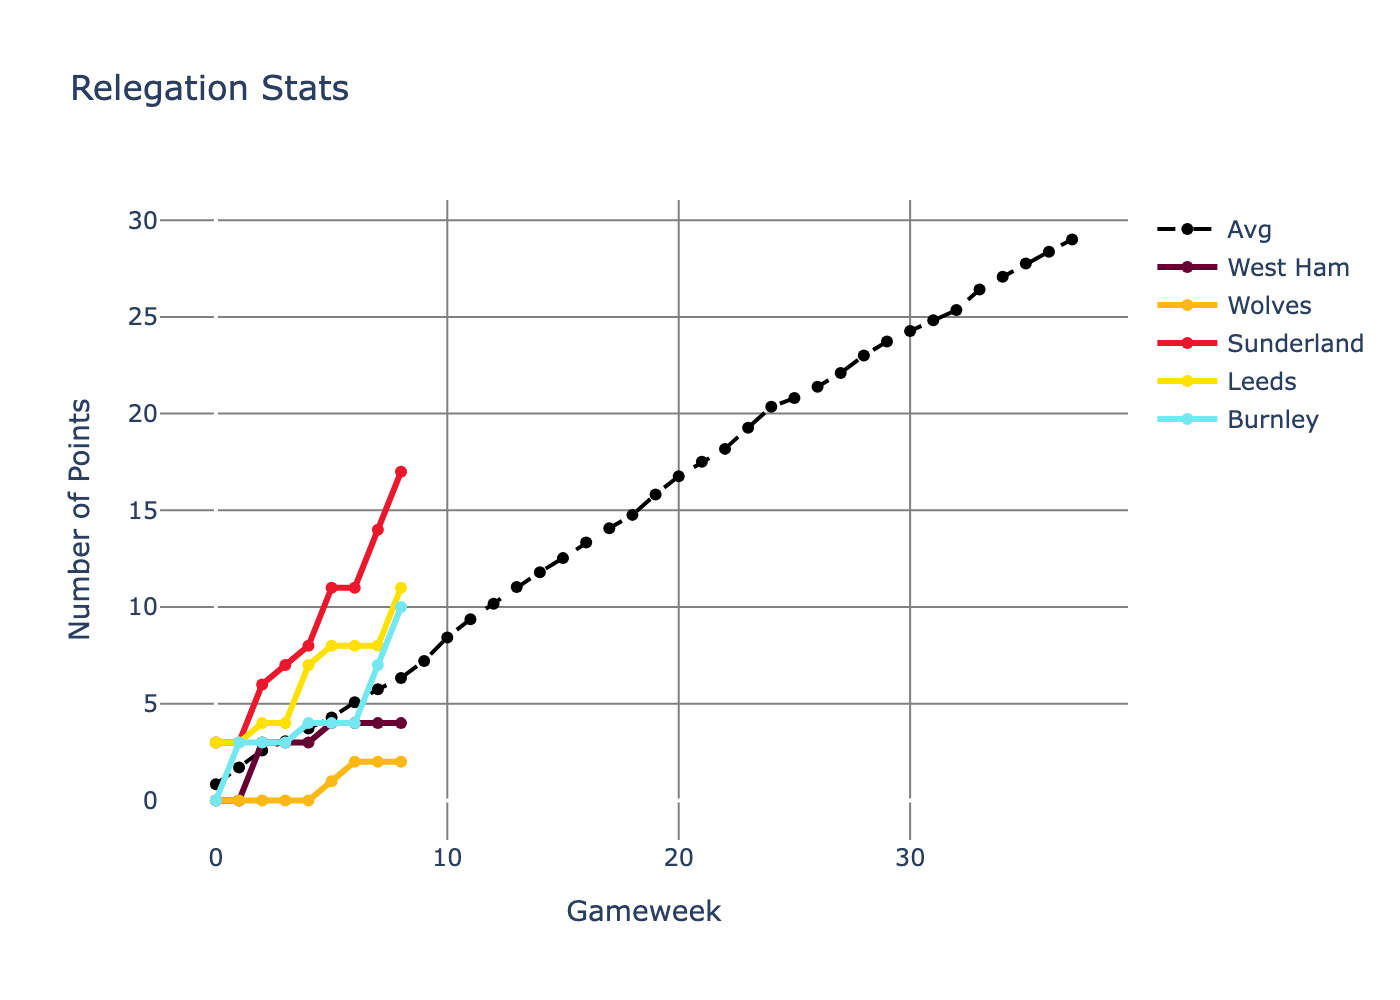
Wolves and West Ham are currently in trouble. They are below the average line at this point in the season, whereas Sunderland is storming it, Leeds are also quite safe, and Burnley’s recent performance have kept them above the fated line.
However, looking at the average points of a relegated team isn’t the best way of looking at this. It can get dragged down by a very poor team at the bottom of the league. Instead we need to look at the minimum and average number of points to stay safe every season.
This is the same calculation as above, but aggregating on the final position of each team and then filtering on position 16, one above the relegation zone.
safe = (teamData.filter(pl.col("Season") != "2526")
                .group_by(["N", "FinalPosition"])
                .agg(pl.col("TotalPoints1").mean(),
                     pl.col("TotalGoals1").mean(),
                    pl.col("TotalGoalsC1").mean(),
                    pl.col("TotalPoints1").min().alias("Min"))
                .sort("N").filter(pl.col("FinalPosition") == 16)
       )
Again, plotting this with the same teams.
fig = go.Figure()
fig.add_trace(go.Scatter(x=safe["N"], y=safe["TotalPoints1"],
                    mode='lines+markers',
                    name='Avg Points of a Safe Team'))

fig.add_trace(go.Scatter(x=safe["N"], y=safe["Min"],
                    mode='lines+markers',
                    name='Min Points of a Safe Team'))

for team in ["West Ham", "Wolves", "Sunderland", "Leeds", "Burnley"]:
    latestTeam = teamData.filter(pl.col("Team1") == team, pl.col("Season") == "2526")

    fig.add_trace(go.Scatter(x=latestTeam["N"], y=latestTeam["TotalPoints1"],
                    mode='lines+markers',
                    name=team))

fig.update_layout(height=500, width=700,
                  title_text="Safety Stats")

fig.show()
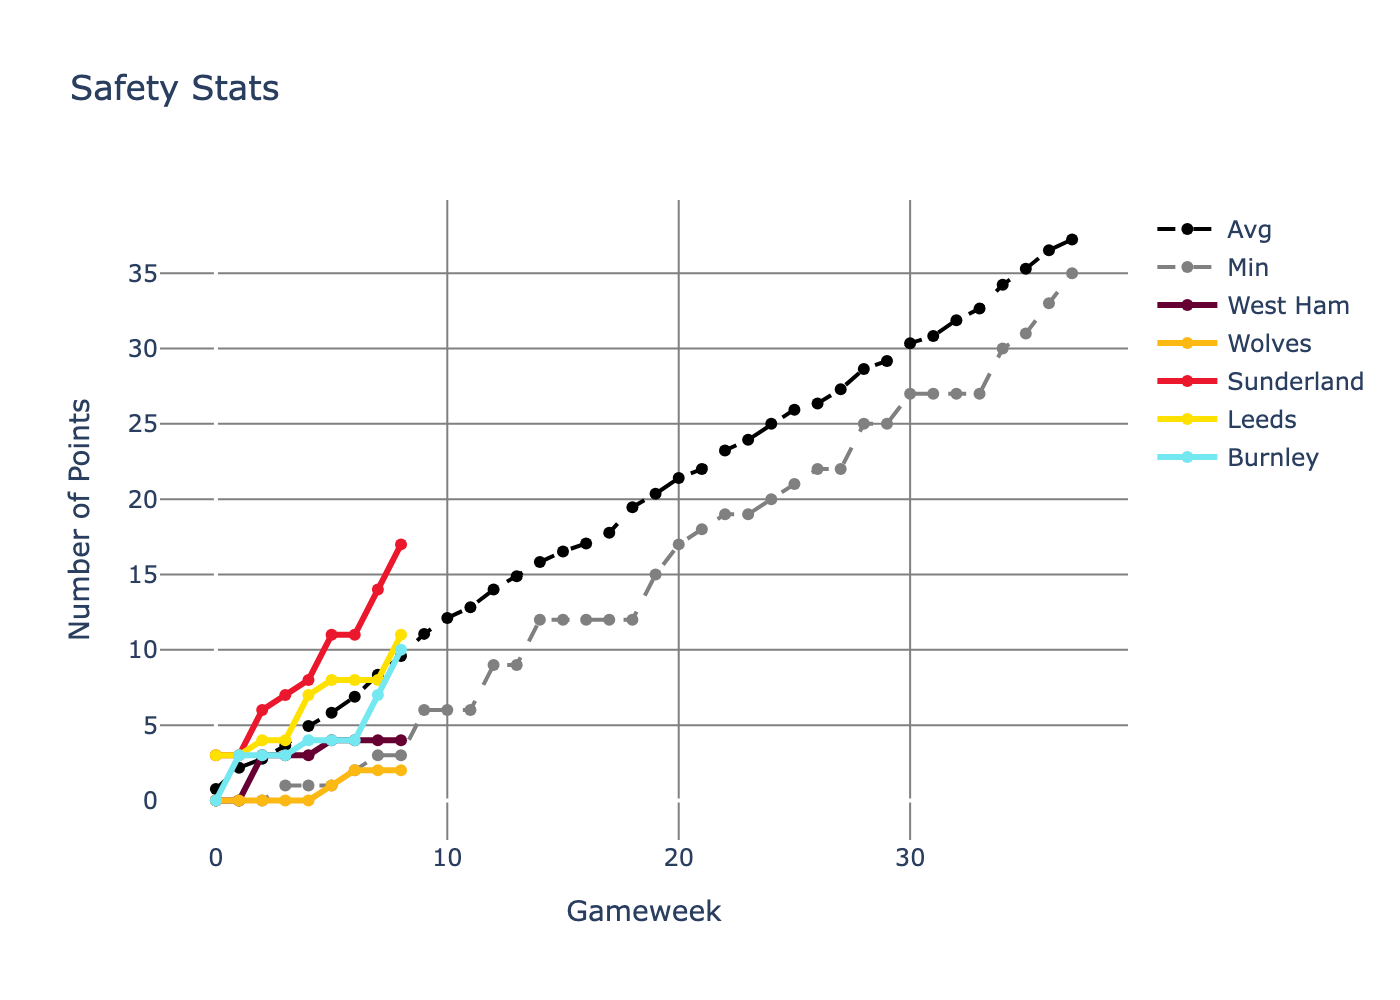
Again, Wolves and West Ham are well below the average line (blue), and Wolves are even below the minimum line (red). Burnley and Leeds are in touching distance. Sunderland is well above. From this, Sunderland should be happy and confident that they can stay up; Leeds are at the bare minimum. Wolves are in big danger, but with a new manager, they might be able to get going again. West Ham have already had their new manager bounce, and it’s still looking precarious.
This also shows that, on average, you need 37.23 points to survive in the Premier League, with 35 as the bare minimum. So the fabled 40 point mark is actually a slight over estimation.
It’s not just points, though. What about the number of goals each team has scored and how many they are conceding? Let’s look at these stats and also format up the graph so it’s a bit less default, and focus just on the games so far.

No real change to the conclusion. Sunderland are doing well on both points and goals scored, and their conceded goals are below the average in the 16th position. Wolves and West Ham are underperforming across the board. Leeds and Burnley are scraping by.
Conclusion
Based on these early-season trajectories, it’s not looking good for West Ham or Wolves. By contrast, Sunderland should be getting excited about the prospect of another season in the Premier League. Leeds and Burnley - not quite out of the woods. As another cliche goes, relegation is about hoping you are better than 3 other teams and at the minute Wolves and West Ham are struggling to find three other worse teams!