Taking Github Copilot for a Spin
GitHub Copilot is the AI tool that gives you code suggestions as you type. It was free for a bit but is going to cost money at the end of August. My free trial was coming to an end, so I thought I would give it a runout and see if it is the future of coding. My aim, replicate my Julia blog post on Order Flow Imbalance into Python and see how much Github Copilot can do for me.
Enjoy these types of posts? Then sign up for my newsletter.
My Python Background
For context, I’m a quant in the finance industry who deals with data, which means working in R and Julia to produce suitable data analysis code. My latest job has me writing Python so I’m slowly getting more productive and confident. Plus I’ve used Python in coding interviews (with good feedback!) and writing blog posts in Python (Optimising a Taskmaster Task with Python, Bulk Downloading from Turnitin using Python), but I am not as productive/confident in Python as I am in the other languages. I’m an A* in Julia/R but only an A in Python. This translation task is therefore an ideal test case for Github Copilot.
The end goal is to take my Order Flow Imbalance post and replicate the main functions in Python. I’ll go through each function and articulate how Copilot performed.
Order Flow Imbalance in 100 Words
In the order book, there are prices and quantities that you can either buy or sell. A change in any of the four quantities can indicate a so-called ‘imbalance’ in the order book and indicate where the price might move. For example, if the bid price increases or the amount at the bid price increases this hints at an increase in the demand for something, and therefore, the price will rise if the demand can’t be met with additional supply. I go through the details in my main blog post and show it has predictive power. Four words to spare!
Translating from Julia to Python with Copilot
Each section will have a function that I’ve written with Copilot’s assistance. I’ll highlight what parts were automatic and where I had to intervene.
Pull the data.
I have a QuestDB database that stores bid and offer data for Bitcoin. QuestDB provides a REST API that lets you run commands with an HTTP request.
def get_data():
  # Get the data from the API
  r = requests.get("http://localhost:9000/exp?query=select * from coinbase_bbo limit 50000")
  # Convert the response to a pandas dataframe
  df = pd.read_csv(io.StringIO(r.text), parse_dates=['timestamp'])
  return df
Copilot suggested the right requests stuff and the correct way to convert it into a dataframe I just had to change from time to timestamp. So just by writing the function definition, it was able to suggest the correct code. Given I needed to google the correct way to write a GET request in Python to verify this was correct I was humbled to be outsmarted by an AI machine!
Calculate the mid-price
Next up, write a function that adds the mid-price to a dataframe. This is finance-specific, but not too obscure, so I wondered whether Copilot would struggle. Mid price is jargon, but, I wrote the function name and it filled the correct body. Colour me impressed.
def add_midprice(df):
  # Add the midprice column to the dataframe
  df['midprice'] = (df['bid'] + df['ask']) / 2
  return df
Interesting that it chose to divide by 2 rather than multiply by 0.5.
Calculate the imbalance
After completing the mid-price function, Copilot then suggested the next function should be add_imbalance which was unexpected. I thought it would always require some sort of prompt, but no, it knew what the next function should be. However, it didn’t know how to calculate the imbalance, it just suggested some price normalisation. This is understandable, the book imbalance isn’t exactly a common term and is specific to high-frequency finance, more so than the mid-price.
def add_imbalance(df):
  # Add the imbalance column to the dataframe
  e = [0] * len(df)
  for i in range(1, len(df)):
    e[i] = (df.bid[i] >= df.bid[i-1]) * df.bidsize[i] - (df.bid[i] <= df.bid[i-1]) * df.bidsize[i-1] - (df.ask[i] <= df.ask[i-1]) * df.asksize[i] + (df.ask[i] >= df.ask[i-1]) * df.asksize[i-1]
  df["Imbalance"] = e
  return df
I wrote this entirely myself. But in the process introduce a few typos that led to some weirdness. My program suddenly started printing the Zen of Python on each run. My typos meant some extra things were imported into the program, so had to delete them to get back on track. So this is the first negative, Copilot started editing the code that wasn’t directly visible, so wasn’t obvious where the program was going wrong.
Aggregate by second
def aggregate_by_second(df):
  # Aggregate the dataframe by second
  df['timestamp'] = df['timestamp'].dt.round('s')
  df = df.groupby(['timestamp']).agg(ofi=('Imbalance', 'sum'), open = ('midprice', 'first'), high = ('midprice', 'max'), low = ('midprice', 'min'), close = ('midprice', 'last'), ticks = ('midprice', 'count')).reset_index()
  df["Return"] = np.log(df.close) - np.log(df.close.shift(1))
  return df
Again all is fine, it put me in the right direction with the full OHLC agg function, and I just had to adjust the column names.
Normalise the order flow imbalance.
I had to type the first mean part but it guessed the standard deviation which again, seemed to come from nowhere. I had to manually perform the final line of the actual normalisation.
def normalise_imbalance(df):
  # Normalise the imbalance column
  df["ofi_avg"] = df["ofi"].rolling(window=5*60).mean()
  df["ofi_std"] = df["ofi"].rolling(window=5*60).std()
  df['ofi_norm'] = (df['ofi'] - df['ofi_avg']) / df['ofi_std']
  return df
So far I had just been writing the function definition and observing what happened. After some googling about I then realised that you can start with comments and then Copilot guesses what you are trying to do. So the next few functions come from that workflow.
Fit the linear model
I start by describing what the function should do and let Copilot fill out the rest.
# Regress the ofi_norm column against the Return column
# include an intercept term
# Remove nans from the dataframe
def regress_imbalance(df):
  from sklearn.linear_model import LinearRegression
  df = df.dropna()
  X = df[['ofi_norm']]
  y = df[['Return']]
  model = LinearRegression().fit(X, y)
  return model
Now I would have used the statsmodels package to fit this type of model, so making sklearn the default package (at least in this example) I think raises a question about bias and understanding what the ‘best’ way to do something. Just because it is popular, is it the best? Tensorflow was the standard neural net package for a while until Pytorch came along. It’s a bit like Google and the SEO optimisations, in the future will people be writing and optimising packages to be included in the Copilot suggestions?
You can say you want to use statsmodels and it will change the process, but again, I would use the smf interface and write the regression formula similar to R.
# Regress the ofi_norm column against the Return column using statsmodels
# include an intercept term
# Remove nans from the dataframe
def regress_imbalance_statsmodels(df):
  import statsmodels.api as sm
  df = df.dropna()
  X = df[['ofi_norm']]
  y = df[['Return']]
  model = sm.OLS(y, X).fit()
  return model
There was also the simple task of adding a column of the predicted returns. Not worth a section.
# Add a column to the dataframe with the model's predicted return
def add_predicted_return(df, model):
  df['predicted_return'] = model.predict(df[['ofi_norm']])
  return df
Plotting the results
This is where I found Copilot most useful. My brain is 90% ggplot2 settings for plotting in R, 9% Julia Plots.jl settings, and 1% for matplotlib in Python. Every week at work I have to google how to rotate the x-axis labels 90 degrees.
# plot the equity curve
# label the x axis with the timestamps
# label the y axis with "Equity curve"
# make the line thicker and red
# add a legend with the model's intercept and coefficient
# save the plot as "equity_curve.png"
# show the plot
def plot_equity_curve(df, model):
  import matplotlib.pyplot as plt
  plt.plot(df.timestamp, np.cumsum(np.sign(df.predicted_return) * df.Return), linewidth=2, color='red')
  plt.xlabel('Time')
  plt.ylabel('Equity curve')
  plt.legend(['Intercept = ' + str(model.intercept_) + ' Coefficient = ' + str(model.coef_[0])])
  plt.savefig('equity_curve.png')
  plt.show()
Copilot didn’t understand what I mean by equity curve, so I had manually write the bit, and the legend needed some tweaking, but overall, this was the most enjoyable part and where Copilot added value.
The resulting graph:
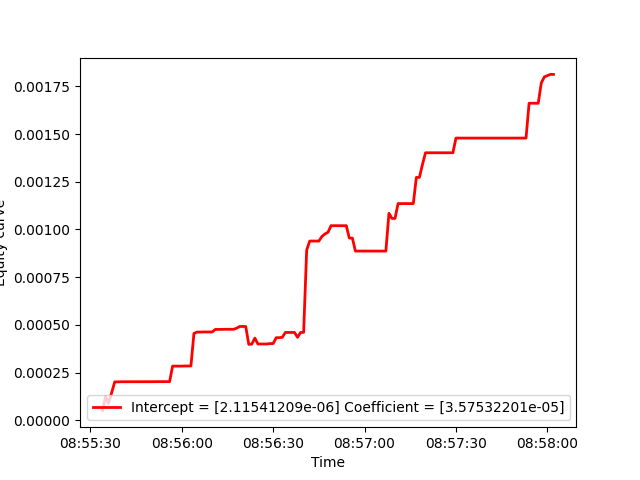
I don’t know why the y-axis label is being cut off, probably my fault rather than Copilots.
Conclusion
I enjoyed using Copilot and it helped improve my productivity. Its suggestions were always close to the mark and if they weren’t it was skeleton code that I was able to alter to the correct function. It never got in the way, nor did it make any suggestion that made me question its ability. The biggest takeaway is the ability to describe the graph I wanted and just let the magic happen, no more googling different settings and wondering if there was a better way to do things.
The one downfall though as I mentioned earlier is taking its suggestions as gospel. If the model fitting case, using sklearn and then trying to calculate the parameter p-values would be a laborious task, whereas using statsmodels the batteries are included, so you might miss the easy way if you don’t know any better. This is where the thin veneer of intelligence starts to break down.
I won’t be paying for it at $10 per month, mainly because I don’t use Python enough and I’m also not one for purchasing developer tools. If it remained free, I would carry on using it and write more Python. If I was interviewing with a company and they were a user of Copilot I would be more interested in the job as it feels like a real technological innovation. Given Amazon is previewing CodeWhisperer this type of assistance doesn’t feel like a fad and I look forward to what is next. We can all dream of Apple one day releasing SiriCode.